Quality engineers at a company that manufactures floor tiles investigate customer complaints about warping in the tiles. To ensure production quality, the engineers measure warping in 10 tiles each working day for 10 days. The upper specification limit for the warping measurement is 6 mm. The engineers know that the distribution of warping follows the Weibull distribution.
The engineers perform nonnormal capability analysis to evaluate how well the tile manufacturing process meets customer requirements.
- Open the sample data, TileWarping.MWX.
- Choose .
- In Single column, enter Warping.
- From Fit distribution, select Weibull.
- In Upper spec, enter 6.
- Click OK.
Interpret the results
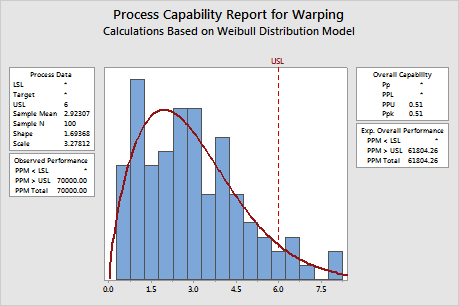
The process data appear to follow the fitted curve of the Weibull distribution. However, measurements on the right tail of the histogram appear to fall above the upper specification limit. Therefore, the warping of the tiles frequently exceeds the upper specification limit of 6 mm. The observed PPM > USL indicates that 70,000 out of every million tiles are above the upper specification limit. The overall Ppk is 0.51, which is less than the generally accepted industry guideline of 1.33. Therefore, the engineers conclude that the process is not capable and does not meet customer requirements.