Everything you see in the Minitab interface is part of your
project.
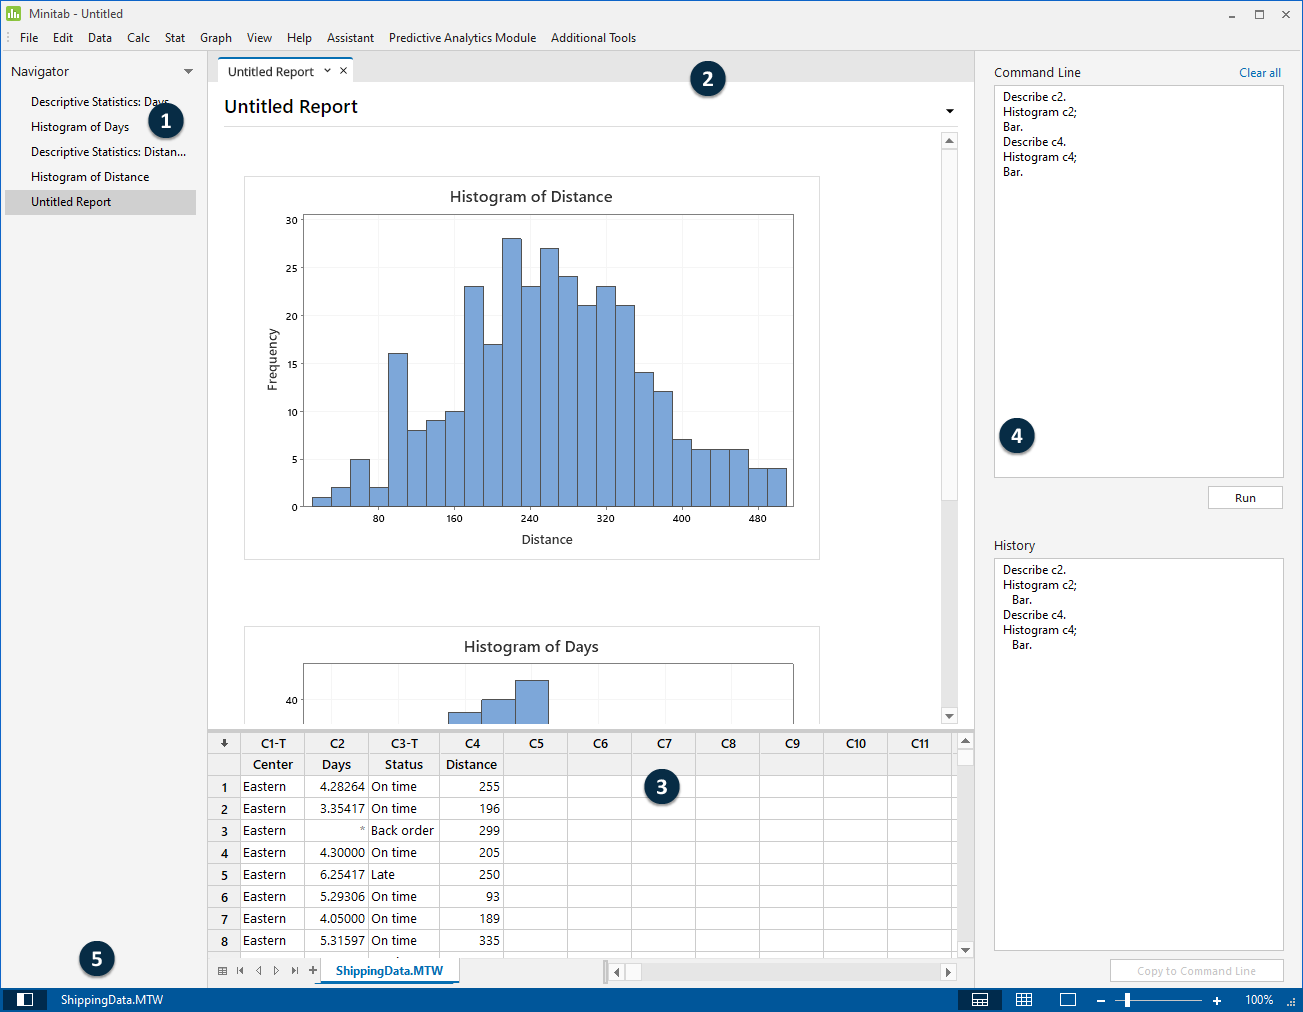
The Minitab interface includes the following components:
- 1: Navigator
- Contains the list of output titles and
report titles in your project. The output and reports are sorted from oldest to
newest, with the most recent items at the bottom of the list. Right-click any
title in the
Navigator
to do the following tasks:
- Open the output or report in split view to compare outputs and to easily drag and drop output into a report.
- Rename the output or report. The name also updates in the output pane.
- Send the output or report to a different application, such as Microsoft® Word, Microsoft® PowerPoint, Minitab Engage™, or Minitab Workspace™.
- Delete the analysis or report from the project. You can undo this action from the Edit menu.
Tip
In Windows, you can select multiple items in the Navigator. Press Shift and left-click your mouse to select contiguous items. Press Ctrl and left-click your mouse to select noncontiguous items.
Tip
If your project has multiple worksheets, you can view the list of output by worksheet. From the Navigator, click
 and choose
Group Commands by Worksheet
and choose
Group Commands by Worksheet
- 2: Output pane
- Displays a list of the output
pages and report pages in a project. Output pages display output such as graphs
or tables after you run an analysis. Report pages display output that you
collect from one or more output pages. From the output pane, you can do the
following tasks:
- To affect the contents
of a tab, click the tab, then click
 next to the output
title.
next to the output
title.
- To affect a specific
table or graph, click the graph or the table, then click
.
- To view output that is not currently visible, click the title of the output or report in the Navigator.
Tip
To compare the output of two different analyses or reports, right-click the second item in the Navigator and choose Open in Split View.
- To affect the contents
of a tab, click the tab, then click
- 3: Data pane (worksheets)
- Displays
the active worksheet. You can have multiple worksheets open in the data pane at
the same time; however, Minitab uses the data in the active worksheet to run the
analysis.
Tip
Right-click the name in the worksheet tab to access the following features:
- Delete the worksheet
- Duplicate the worksheet
- Rename the worksheet
- Create or edit the worksheet description
- Display information about the worksheet in the output pane
- 4: Command Line/History pane
- By default, this pane is not shown. To show this pane, choose
. If you close Minitab while the pane
is visible, the pane is visible the next time you open Minitab.
- Command Line
- The location where you can enter or paste command language to perform an analysis.
- History
- The command language that Minitab uses to run an analysis. You can select and copy commands and subcommands from the History pane to the Command Line pane, where you can edit and run them again.
- 5: Status bar
- Use the status bar to show or hide the
Navigator,
the data pane, or the output pane. You can also zoom in or zoom out on a graph
or a worksheet, depending on whether the data pane or the output pane is
selected.
- Click
 to show or hide the
Navigator.
to show or hide the
Navigator.
- Click
 to show the output
pane and the data pane at the same time.
to show the output
pane and the data pane at the same time.
- Click
 to show only the
data pane.
to show only the
data pane.
- Click
 to show only the
output pane.
to show only the
output pane.
- Click