Single
Create a probability plot that displays the distribution of values for one variable. For example, the following probability plot shows the distribution of calcium values.
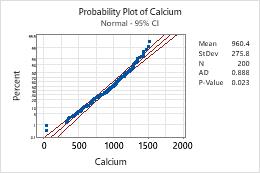
For more information, go to Create a single probability plot.
Multiple
Create a probability plot that displays the distributions of multiple groups on the same graph. For example, the following probability plot shows the distribution of calcium values for two groups.
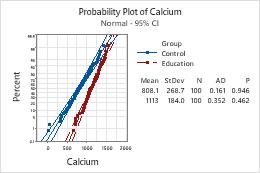
For more information, go to Create a multiple probability plot.