Choose data display elements
The following images show the elements that you can display on an interval plot or an individual value plot. To select elements when you create the graph, click Data View.
- Double-click the graph.
- Right-click the graph and choose .
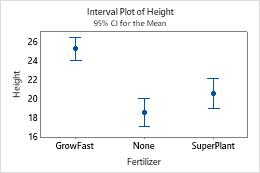
Interval bars and mean symbols
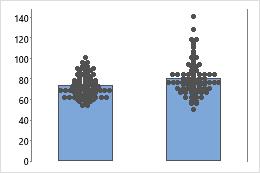
Bars and individual symbols
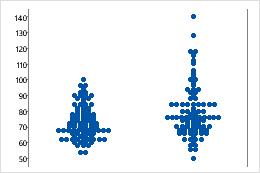
Individual symbols
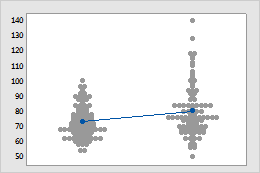
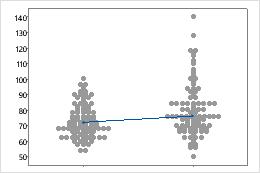
Mean symbols, connect line, and individual symbols
Median symbols, connect line, and individual symbols
Note
For more information on editing these graph features, go to the following topics.
Make groups look different
When you create a plot with groups, you can represent the groups for specified variables with different colors. When you create the graph, click Data View and enter the variables in Categorical variables for attribute assignment.
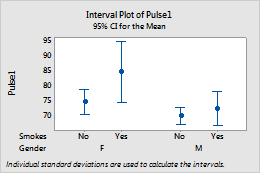
Default
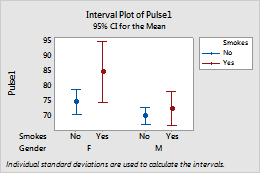
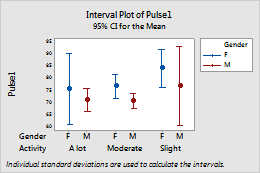
Different colors for Gender
Note
For information on adding or changing the grouping variables for an existing graph, go to Display groups on graphs.
Apply existing groups when you add new elements
- Double-click the graph
- Right-click the graph and choose .
To apply the existing legend groups when you add a new data display, select Apply attribute assignment variables of current displays to added displays. To apply the existing legend groups when you add a new element, select Apply attribute assignment variables of current displays to added displays.
For example, the symbols and interval bars in the following interval plot are different colors for the different levels of the Gender variable.
If you add bars, but do not select Apply attribute assignment variables of current displays to added displays, all of the bars are the default blue color. If you select this option, then the bar colors match the color of the symbols and interval bars.
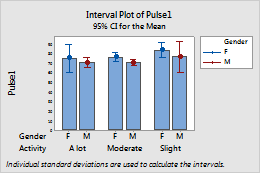
Not selected
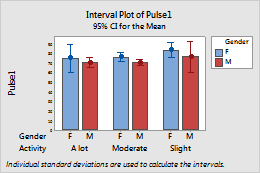
Selected
Note
For information on how to change the attribute assignment variables for existing data display elements, go to Display groups on graphs.