Complete the following steps to specify the data for your graph.
- In Graph variables, enter one or more columns that you want to graph. By default, Minitab creates a separate graph for each variable.
- In Categorical variables for grouping (1-4, outermost first), enter up to four columns of categorical data that defines the groups.
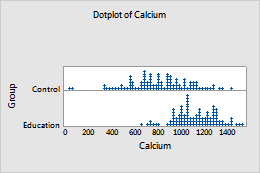
In this worksheet, Calcium is the graph variable and Group is the categorical variable for grouping. The graph shows the distribution of calcium values for each group. Groups are displayed on separate panels of the same graph.
| C1 | C2 |
|---|---|
| Calcium | Group |
| 646.72 | Control |
| 1120.67 | Education |
| 1067.25 | Control |
| ... | ... |