A packaging engineer wants to test a new method to seal snack bags. The force that is required to open the bags should be within 10% of the target value of 4.2 N (Newtons). Before collecting the data for a 1-sample equivalence test, the engineer uses a power and sample size calculation to determine how large the sample must be to obtain a power of 80% (0.8). From previous samples, the engineer estimates the standard deviation of the population is 0.332.
- Choose .
- From What do you want to determine? (Alternative hypothesis), choose Lower limit < test mean - target < upper limit.
- In Lower limit, enter –0.42. In Upper limit, enter 0.42.
- In Differences (within the limits), enter 0 0.1 0.2 0.3.
- In Power values, enter 0.8.
- In Standard deviation, enter 0.332.
- Click OK.
Interpret the results
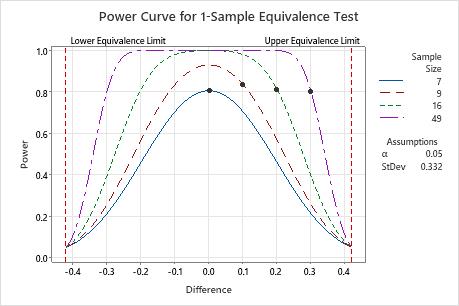
If the difference is 0 (the mean force is on target), then the engineer needs a sample size of 7 to achieve a power of 0.8. If the engineer uses a sample size of 9, the power of the test is over 0.9 for a difference of 0.
When the difference is closer to the upper equivalence limit (0.42), the engineer needs a larger sample size to achieve the same power. For example, for a difference of 0.3, the engineer needs a sample size of 49 to achieve a power of 0.8.
For any sample size, as the difference approaches the lower equivalence limit or the upper equivalence limit, the power of the test decreases and approaches α (alpha, which is the risk of claiming equivalence when it is not true).
Method
| Power for difference: | Test mean - target |
|---|---|
| Null hypothesis: | Difference ≤ -0.42 or Difference ≥ 0.42 |
| Alternative hypothesis: | -0.42 < Difference < 0.42 |
| α level: | 0.05 |
| Assumed standard deviation: | 0.332 |
Results
| Difference | Sample Size | Target Power | Actual Power |
|---|---|---|---|
| 0.0 | 7 | 0.8 | 0.805075 |
| 0.1 | 9 | 0.8 | 0.834590 |
| 0.2 | 16 | 0.8 | 0.811465 |
| 0.3 | 49 | 0.8 | 0.802154 |