Select the method or formula of your choice.
Confidence interval (CI)
Formula
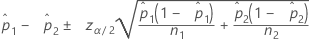
Notation
| Term | Description |
|---|---|
 | estimate of the first population proportion |
 | estimate of the second population proportion |
| n1 | number of trials in the first sample |
| n2 | number of trials in the second sample |
| zα/2 | inverse cumulative probability of the standard normal distribution at 1 – α/2 |
| α | 1 – confidence level/100 |
Normal approximation test
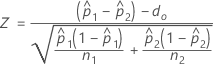
The calculation of the test statistic, Z, depends on the method used to estimate p.
- Separate estimates of p
- By default, Minitab uses separate estimates of p for each population and calculates Z as follows:
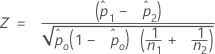
- Pooled estimate of p
- If the hypothesized test difference is zero and you choose to use a pooled estimate of p for the test, Minitab calculates Z as follows:
The p-value for each alternative hypothesis is:
- H1: p1 > p2 : p-value = P(Z1 ≥ z)
- H1: p1 < p2 : p-value = P(Z1 ≤ z)
- H1: p1 ≠ p2 : p-value = 2P(Z1 ≥ z)
Calculate these probabilities on the standard normal distribution.
Notation
| Term | Description |
|---|---|
| p1 | true proportion of events in the first population |
| p2 | true proportion of events in the second population |
 | observed proportion of events in the first sample |
 | observed proportion of events in the second sample |
| n1 | number of trials in the first sample |
| n2 | number of trials in the second sample |
| d0 | hypothesized difference between the first and second proportions |
 |  |
| x1 | number of events in the first sample |
| x2 | number of events in the second sample |
Fisher's exact test
Minitab performs Fisher's exact test in addition to a test based on a normal approximation. Fisher's exact test is valid for all sample sizes.
Formula
Under the null hypothesis, the number of events in the first sample (x1) has a hypergeometric distribution with these parameters:
- Population size = n1 + n2
- Number of events in population = x1 + x2
- Sample size = n1
Let f( ) and F( ) denote the PDF and CDF of this hypergeometric distribution, respectively. Let Mode denote its mode. The p-values for each alternative hypothesis are as follows:
- H1: p1 < p2
p-value = F(x1)
- H1: p1 > p2
p-value = 1 – F(x1 – 1)
- H1: p1 ≠ p2
Three cases exist:
- Case 1: x1 < Mode
p-value = p-lower + p-upper
Term Description p-lower F(x1) p-upper 1 – F(y – 1) y smallest integer > Mode such that f(y) <f(x1) Note
p-upper may equal zero.
- Case 2: x1 = Mode
p-value = 1.0
- Case 3: x1 > Mode
p-value = p-lower + p-upper
Term Description p-upper 1 – F(x1 – 1) p-lower F(y) y largest integer < Mode such that f(y) < f(x1) Note
p-lower may equal zero.
- Case 1: x1 < Mode
Notation
| Term | Description |
|---|---|
| p1 | true proportion of events in the first population |
| p2 | true proportion of events in the second population |
| x1 | number of events in the first sample |
| x2 | number of events in the second sample |
| n1 | number of trials in the first sample |
| n2 | number of trials in the second sample |