A quality engineer from a plastic manufacturing company would like to make sure his batch process stays in control. The engineer measures the concentration of pigment of each batch for all 35 batches.
- Open the sample data, PigmentConcentration.MWX.
- Choose .
- From the drop-down list, select All observations for a chart are in one column, enter Pigment.
- In Subgroup sizes, enter 1.
- Click OK.
Interpret the results
Batch 28 is above the upper control limit. The engineer should investigate why the concentration of pigment for this batch is more than what is expected.
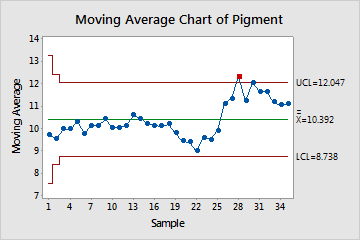
Test Results for Moving Average Chart of Pigment
| TEST 1. One point more than 3.00 standard deviations from center line. |
|---|
| Test Failed at points: 28 |