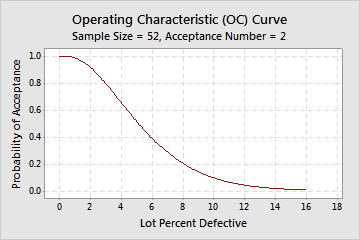
The operating characteristic (OC) curve depicts the discriminatory power of an acceptance sampling plan. The OC curve plots the probabilities of accepting a lot versus the fraction defective.
When the OC curve is plotted, the sampling risks are obvious. You should always examine the OC curve before using a sampling plan.
For example, you sample 52 pens from a shipment of 5000. If the actual % defective is 1.5%, you have a 0.957 probability of accepting this lot based on the sample and a 0.043 probability of rejecting it. If the actual % defective is 10%, you have a 0.097 probability of accepting this lot and a 0.903 probability of rejecting it.
Examine the OC curves, AOQ curves, and ATI curves together when evaluating sampling plans.
Use an OC curve to choose an appropriate sampling plan
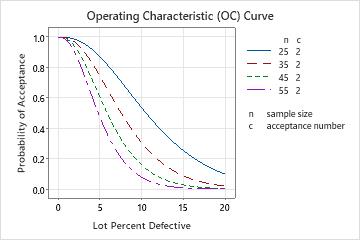
You can compare OC curves to help choose the appropriate sampling plan. In this case, the shift supervisor thinks sampling 52 pens from 5000 is too many. You can develop curves for various sample sizes and acceptance numbers to illustrate the increased risk.
If the sample size is 35 (red line) and the % defective is 10%, you now have a 0.306 probability of accepting this lot.