In This Topic
Determine sample size and acceptance criteria for a new acceptance sampling plan
When you create an acceptance sampling plan, you must determine how many items to inspect from a lot of product, and determine how many defects/defective items are allowed in an acceptable lot.
Using your specifications for lot size, AQL, RQL, producer's risk (α), and consumer's risk (β), Minitab determines an appropriate sampling plan with a specific sample size and acceptance number.
Generated Plan(s)
| Sample Size | 52 |
|---|---|
| Acceptance Number | 2 |
| Percent Defective | Probability Accepting | Probability Rejecting | AOQ | ATI |
|---|---|---|---|---|
| 1.5 | 0.957 | 0.043 | 1.420 | 266.2 |
| 10.0 | 0.097 | 0.903 | 0.956 | 4521.9 |
Key Results: Sample Size, Acceptance Number
In these results, the sample size is 52. You must sample 52 items from the entire lot of product. The acceptance number is 2. If 2 or less defective items are found, you replace the defective items and accept the entire lot. If 3 or more defective items are found, you reject the entire lot.
Compare the probability of accepting or rejecting lots from alternative plans
After you create an acceptance sampling plan, you can vary the sample size and acceptance number to reduce overall sample size or to better match your inspection process. For example, your operators might prefer to sample items in quantities of 10 because that is more convenient.
You can compare plans by varying the sample size, the acceptance number, or both together, and examine how the risks of acceptance vary.
Compare User Defined Plan(s)
| Sample Size(n) | Acceptance Number(c) | Percent Defective | Probability Accepting | Probability Rejecting | AOQ | ATI |
|---|---|---|---|---|---|---|
| 40 | 1 | 1.5 | 0.879 | 0.121 | 1.308 | 639.6 |
| 40 | 1 | 10.0 | 0.080 | 0.920 | 0.798 | 4600.9 |
| 50 | 1 | 1.5 | 0.827 | 0.173 | 1.229 | 904.8 |
| 50 | 1 | 10.0 | 0.034 | 0.966 | 0.334 | 4832.8 |
| 60 | 1 | 1.5 | 0.773 | 0.227 | 1.145 | 1182.5 |
| 60 | 1 | 10.0 | 0.014 | 0.986 | 0.136 | 4931.9 |
| 40 | 2 | 1.5 | 0.978 | 0.022 | 1.455 | 149.5 |
| 40 | 2 | 10.0 | 0.223 | 0.777 | 2.210 | 3894.9 |
| 50 | 2 | 1.5 | 0.961 | 0.039 | 1.427 | 244.3 |
| 50 | 2 | 10.0 | 0.112 | 0.888 | 1.106 | 4446.9 |
| 60 | 2 | 1.5 | 0.939 | 0.061 | 1.391 | 363.7 |
| 60 | 2 | 10.0 | 0.053 | 0.947 | 0.524 | 4738.0 |
Key Results: Probability Accepting, Probability Rejecting
At each of the sample sizes, when the acceptance number is 1, the probability of accepting at the AQL is less than the probabilities of acceptance when the acceptance number is 2.
At each of the sample sizes, when the acceptance number is 1, the probability of rejecting at the RQL is higher than the probabilities of rejecting when the acceptance number is 2.
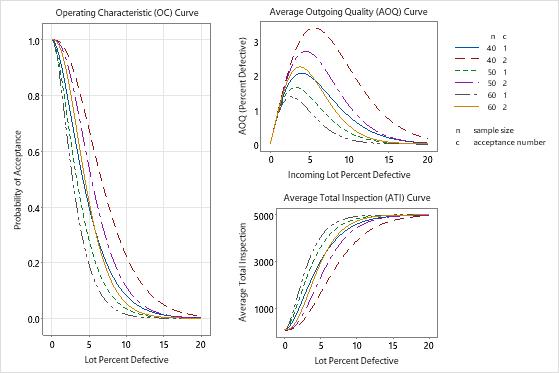
The acceptance sampling graphs help you visually compare sampling plans. The plan with a sample size of 50 and an acceptance number of 2 seems to best match the target α risk of 5% at the AQL and the target β risk of 10% at the RQL.
The plan with a reduced sample size of 40 and an acceptance number of 1 has a risk of rejecting a lot that has 1.5% quality level of 12.1%. This may be an acceptable risk for the reduced sample size. However when the sample size is 40 and the acceptance number is 2, the probability of accepting at the RQL (0.223) is too high.