A chemical engineer wants to compare the hardness of four blends of paint. Six samples of each paint blend were applied to a piece of metal. The pieces of metal were cured. Then each sample was measured for hardness. In order to test for the equality of means and to assess the differences between pairs of means, the analyst uses one-way ANOVA with multiple comparisons.
- Open the sample data, PaintHardness.MWX.
- Choose .
- Select Response data are in one column for all factor levels.
- In Response, enter Hardness.
- In Factor, enter Paint.
- Click the Comparisons button, then select Tukey.
- Click OK in each dialog box.
Interpret the results
The p-value for the paint hardness ANOVA is less than 0.05. This result indicates that the hardness of the paint blends differs significantly. The engineer knows that some of the group means are different.
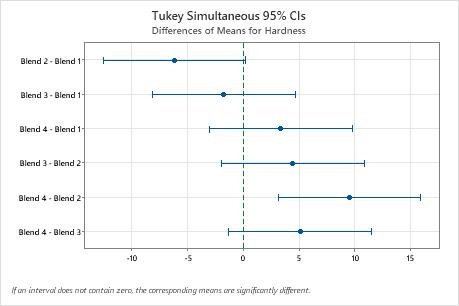
The engineer uses the Tukey comparison results to formally test whether the difference between a pair of groups is statistically significant. The graph that includes the Tukey simultaneous confidence intervals show that the confidence interval for the difference between the means of Blend 2 and 4 is 3.114 to 15.886. This range does not include zero, which indicates that the difference between these means is significant. The engineer can use this estimate of the difference to determine whether the difference is practically significant.
The confidence intervals for the remaining pairs of means all include zero, which indicates that the differences are not significant.
The low predicted R2 (24.32%) value indicates that the model generates imprecise predictions for new observations. The imprecision may be due to the small size of the groups. Thus, the engineer should not use the model to make generalizations beyond the sample data.
Method
| Null hypothesis | All means are equal |
|---|
| Alternative hypothesis | Not all means are equal |
|---|
| Significance level | α = 0.05 |
|---|
Factor Information
| Paint | 4 | Blend 1, Blend 2, Blend 3, Blend 4 |
|---|
Analysis of Variance
| Paint | 3 | 281.7 | 93.90 | 6.02 | 0.004 |
|---|
| Error | 20 | 312.1 | 15.60 | | |
|---|
| Total | 23 | 593.8 | | | |
|---|
Model Summary
| 3.95012 | 47.44% | 39.56% | 24.32% |
Means
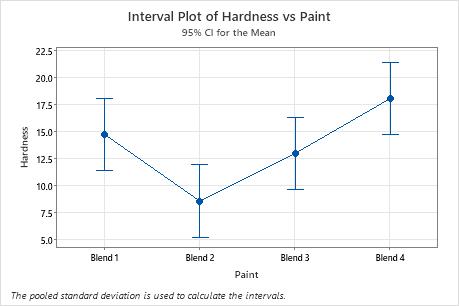
| Blend 1 | 6 | 14.73 | 3.36 | (11.37, 18.10) |
|---|
| Blend 2 | 6 | 8.57 | 5.50 | (5.20, 11.93) |
|---|
| Blend 3 | 6 | 12.98 | 3.73 | (9.62, 16.35) |
|---|
| Blend 4 | 6 | 18.07 | 2.64 | (14.70, 21.43) |
|---|
Grouping Information Using the Tukey Method and 95% Confidence
| Blend 4 | 6 | 18.07 | A | |
|---|
| Blend 1 | 6 | 14.73 | A | B |
|---|
| Blend 3 | 6 | 12.98 | A | B |
|---|
| Blend 2 | 6 | 8.57 | | B |
|---|