Assess the quality of your data
Data quality checks
Data quality checks help identify issues that can affect the accuracy, completeness, and reliability of data as it moves through a pipeline.
Enable Data Quality Checks
Data Quality Checks are enabled by default for each Cleanup node. You can turn data quality checks on or off for an individual Cleanup node.
- Select the Cleanup node.
-
Open Data Quality.
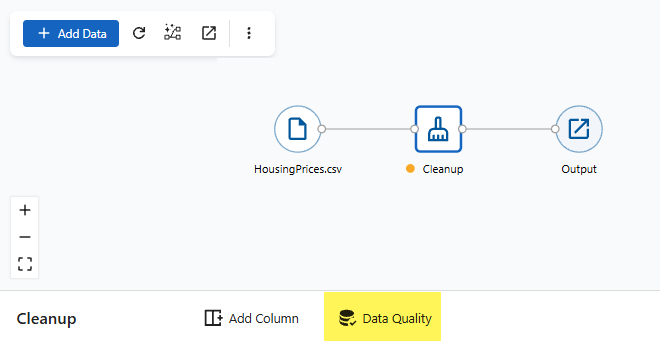
- Turn Enable checks on or off.
- Select Save to apply your changes.
Review results
The Data Quality Summary updates when you select a different step so that the column details reflect the selected step's result. Open the side pane for more information.
Quality issue indicator
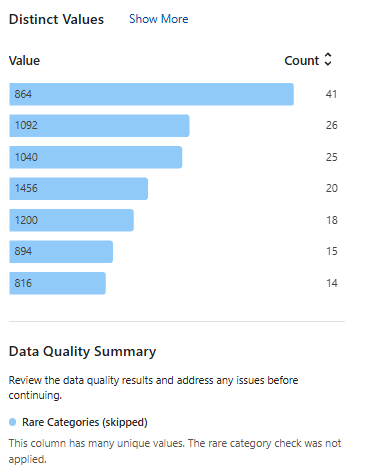
Skipped indicator
A blue dot indicates that data quality checks were skipped.
Missing values
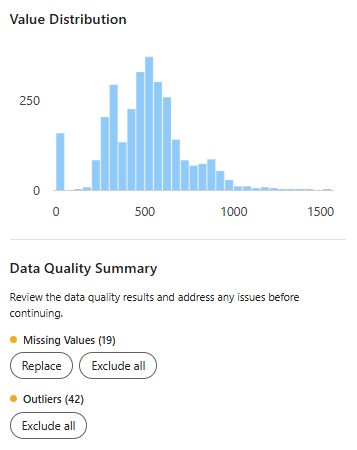
The quality check for Missing Values identifies records that contain empty or null values in required fields.
Missing values can lead to incomplete analysis, processing errors, and unreliable results. Monitoring missing values helps ensure data is complete and suitable for downstream use.
Available columns
Missing value detection is available for all columns.
Resolve missing values
- Replace
- Open the Replace dialog to specify a new value for the missing value.
- Exclude all
- Create a filter that excludes all missing values.
Outliers
The quality check for Outliers identifies values that are significantly higher or lower than other values in the dataset.
Outliers may indicate data entry errors, measurement issues, unexpected conditions, or meaningful changes in a process. Monitoring outliers helps identify potential data quality issues and highlights records that may require further investigation.
Available columns
Outlier detection is available for numeric columns.
Method
The Interquartile Range (IQR) method identifies outliers by looking for values that fall unusually far from the middle 50% of the data.
Any value outside these bounds is considered an outlier.
Lower Bound=Q1−1.5×IQRUpper Bound=Q3+1.5×IQR
Resolve outliers
Note
Create a boxplot in Minitab Statistical Software to identify and investigate potential outliers.
Rare categories
The quality check for Rare Categories identifies categories that occur infrequently in a data column.
Rare categories are values that occur infrequently compared to the size of the dataset. Rare categories can indicate typos, misspellings, inconsistent capitalization, or other data quality issues that can affect analysis, statistical modeling, and machine learning results.
Available columns
- Text columns
- Numeric or date/time columns that have 5 or fewer distinct values
Rare category detection is not performed on numeric or date/time columns that are treated as continuous data. Missing values are not treated as rare categories.
Method
Minitab Data Center calculates the percentage of records represented by each category. Any category with a percentage of less than 5% is considered rare.
Resolve rare categories
- Replace value
- Specify a new value for the rare category.
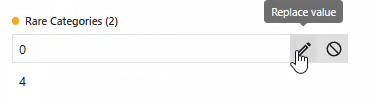
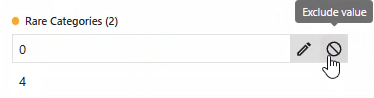
- Exclude value
- Create a filter that excludes a rare category.