Skewness
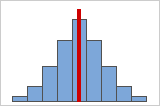
Figure A
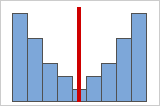
Figure B
Symmetrical or non-skewed distributions
As data becomes more symmetrical, its skewness value approaches zero. Figure A shows normally distributed data, which by definition exhibits relatively little skewness. By drawing a line down the middle of this histogram of normal data it's easy to see that the two sides mirror one another. But lack of skewness alone doesn't imply normality. Figure B shows a distribution where the two sides still mirror one another, though the data is far from normally distributed.
Positive or right skewed distributions
Positive skewed or right skewed data is so named because the "tail" of the distribution points to the right, and because its skewness value will be greater than 0 (or positive). Salary data is often skewed in this manner: many employees in a company make relatively little, while increasingly few people make very high salaries.
Negative or left skewed distributions
Left skewed or negative skewed data is so named because the "tail" of the distribution points to the left, and because it produces a negative skewness value. Failure rate data is often left skewed. Consider light bulbs: very few will burn out right away, the vast majority lasting for quite a long time.
Kurtosis
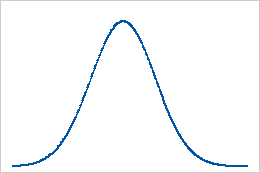
Baseline: Kurtosis value of 0
Data that follow a normal distribution perfectly have a kurtosis value of 0. Normally distributed data establishes the baseline for kurtosis. Sample kurtosis that significantly deviates from 0 may indicate that the data are not normally distributed.
Positive kurtosis
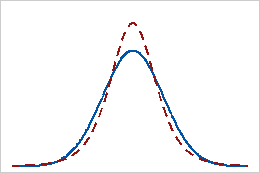
A distribution with a positive kurtosis value indicates that the distribution has heavier tails than the normal distribution. For example, data that follow a t distribution have a positive kurtosis value. The solid line shows the normal distribution and the dotted line shows a distribution with a positive kurtosis value.
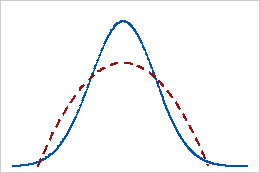
Negative kurtosis
A distribution with a negative kurtosis value indicates that the distribution has lighter tails than the normal distribution. For example, data that follow a beta distribution with first and second shape parameters equal to 2 have a negative kurtosis value. The solid line shows the normal distribution and the dotted line shows a distribution with a negative kurtosis value.