A confidence band is the lines on a probability plot or fitted line plot that depict the upper and lower confidence bounds for all points on a fitted line within the range of data. On a fitted line plot, the confidence interval for the mean response of a specified predictor value are the points on the confidence bands directly above and below the predictor value.
For example, a materials engineer at a furniture manufacturing site wants to assess the strength of the particle board that they use. They collect stiffness data from particle board pieces with various densities. The engineer uses linear regression to create a fitted line plot of the relationship between stiffness and density. The confidence bands above and below the fitted line represent confidence intervals for the mean response of a specified predictor value. For example, the model indicates with 95% confidence that a density of 15 will generate a mean stiffness between approximately 28 and 35, which are the y-values of the lower and upper confidence bands at X = 15.
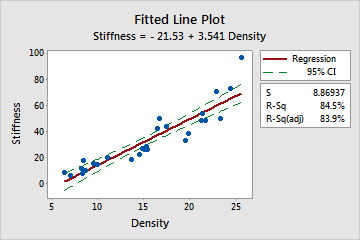
Density vs. Stiffness
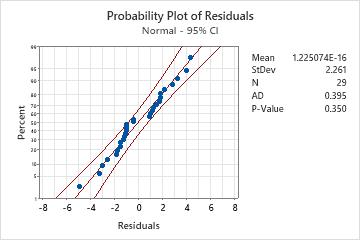
Probability plot of residuals
All the points fall close to the fitted line, so the assumption that the residuals are normal is reasonable. The Anderson-Darling statistic (0.395) and p-value (0.35) confirm this conclusion.
Note
For a fitted line plot, the confidence intervals that form the confidence bands are calculated separately for each point on the fitted line, without controlling for family error. Therefore, if you use 95% confidence bands to estimate more than one parameter per sample, your actual confidence level for the group of estimates will be less than 95%.