Note
This command is available with the Predictive Analytics Module. Click here for more information about how to activate the module.
One predictor partial dependence plots
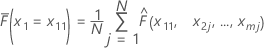
Assume there are m predictors in a training data set, denoted as x1, x2, ..., xm. First, sort the distinct values of predictor x1 in the training data set in increasing order. Denote x11 as the first distinct value of x1. Then, x11 is the x-coordinate for the leftmost point on the plot.
| Term | Description |
|---|---|
| N | the total number of rows in the training data set |
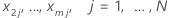 | the observed values for  in the training data set
 |
| j | each individual row of the J rows |
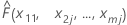 | the fitted value from the model when x1 = x11, x2 = x2j,...., xm = xmj |
Replacing x11 by each of the distinct values of x1, we get the y-coordinates for the rest of the points on the plot. The calculations for the rest of the predictors are done similarly.
Calculations of all the y-coordinates for all distinct values of x can be time consuming with large data sets. For TreeNet® models, there is a faster way to do the calculations. Refer to Friedman, J. H. (2001). Greedy function approximation: A gradient boosting machine. The Annals of Statistics, 29(5), page 1221.
The calculations for multinomial response case are similar. Here the fitted value is from the model for each individual class.
Two predictor partial dependence plots
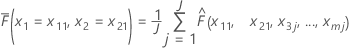
Assume there are m predictors in a training data set, denoted as x1, x2, ..., xm. First, sort the distinct values of predictors x1, x2 in the training data set in increasing order. Denote x11, x21 as one of the distinct pairs. Then, each pair makes the x and y-coordinates for a point on the surface plot.
| Term | Description |
|---|---|
| N | the total number of rows in the training data set that all share the commonality of x1 = x11, x2 = x21 |
 | the observed values for  in the training data set
 |
| j | each individual row of the J rows |
 | the fitted value from the model when x1 = x11, x2 = x21, x3 = x3j...., xm = xmj |
The completion of the calculations for all distinct value combinations of x1 and x2 produces all the z-coordinates for the contour or surface plot. For large data sets, the calculations for all distinct pairs of x and y are time consuming. For TreeNet® models, there is a faster way to do the calculations. Refer to Friedman, J. H. (2001). Greedy function approximation: A gradient boosting machine. The Annals of Statistics, 29(5), page 1221.