Note
This command is available with the Predictive Analytics Module. Click here for more information about how to activate the module.
To add more partial dependence plots, select or in the results.
One Predictor Partial Dependence Plot
The one predictor partial dependence plot indicates how the response is expected to change with changes in the predictor levels.
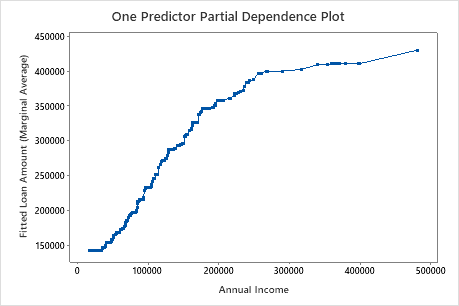
This plot illustrates that the fitted loan amount increases as the annual income increases. When annual income approaches, $500000, the fitted loan amount levels out at approximately $217000.
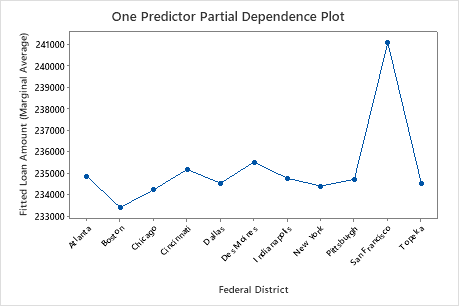
This plot illustrates that the fitted loan amount varies between the location of the federal district. Boston has the lowest fitted loan amount and San Francisco has the highest fitted loan amount.
Two Predictor Partial Dependence Plot
The two predictor partial dependence plot shows the interaction effects of the plotted predictors on the marginal average of the fits. The two predictor partial dependence plot indicates how the response is expected to change with changes in the predictor levels of two important variables. For categorical predictors, Minitab displays a matrix plot of the various relationships at the various levels of the predictors. For continuous predictors, Minitab displays a surface plot or a contour plot of this relationship.
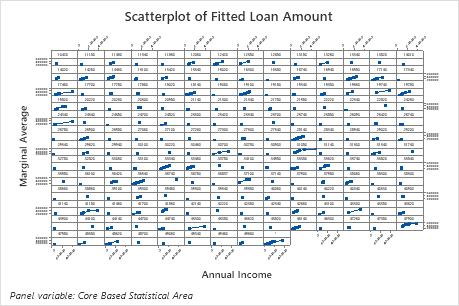
This scatterplot illustrates the marginal average of the loan amount for each core based statistical area based on annual income. Because there are so many data points, you can hover over individual data points to see the specific data values.
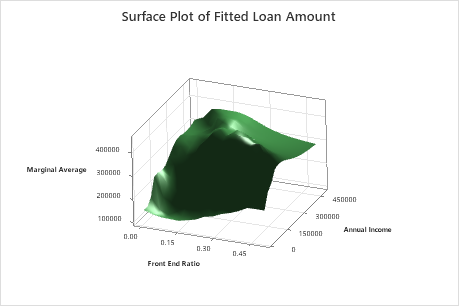
The highest loan amounts are when the annual income is higher and the front end ratio is between 0.15 – 0.30.
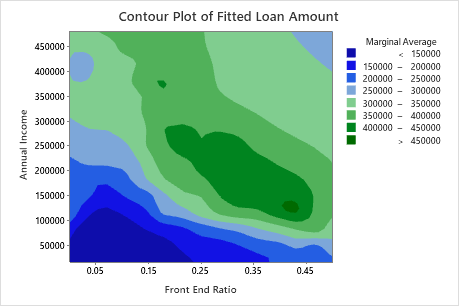
The darkest levels are the highest loan amounts. Most of the highest loan amounts occur when the front end ratio > 0.15 and annual income > $100000.