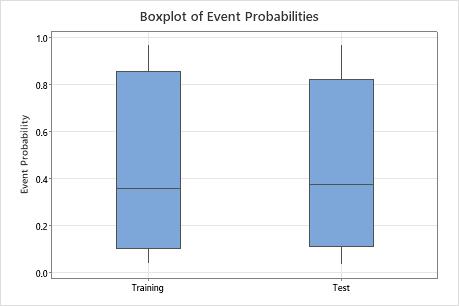
Use the Boxplot of Event Probabilities to assess and compare the shape,
central tendency, and variability of the training and test samples.
Interpretation
Hold the pointer over the boxplot to display a tooltip that shows summary statistics.
For example, the boxplot shows that the median event probability of the data is
0.358. Most cases have an event probability that is between 0.1 and 0.85.