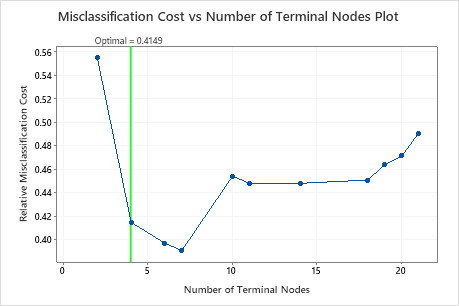
The most accurate tree is the tree with the lowest misclassification cost. This tree is also known as the optimal tree.
Sometimes, simpler trees with slightly higher misclassification costs work just as well. Typically, a tree with fewer terminal nodes gives a clearer picture of how each predictor variable affects the response values. A smaller tree also makes it easier to identify a few target groups for further studies. If the difference in prediction accuracy for a smaller tree is negligible, you can use the smaller tree to evaluate the relationships between the response and the predictor variables.
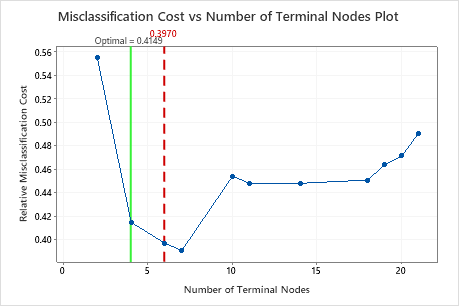
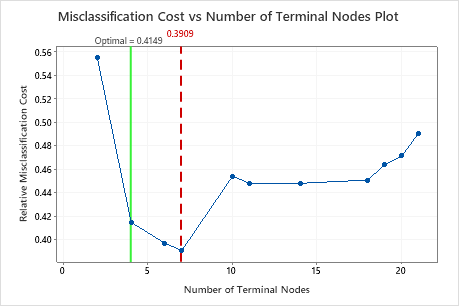
Click Select Alternative Tree to open an interactive view of the plot that includes a table of model summary statistics. Use the plot to investigate smaller trees with similar performance.
Interpretation