In This Topic
Method
Analysis of means is a procedure to determine if individual factor level means are different from the grand mean (mean of all observations in a factor). Listed below are the steps Minitab uses to compute ANOM results for a one-way model:
- Computes the mean at each factor level, y̅i. (i = 1, …, r).
- Computes the grand mean of all observations, y….
- Computes sp, an estimate of the standard deviation of observation.
- Determines the value hα, which is the corresponding value to the significance level chosen for the test and is used in the upper and lower decision lines.
- Computes the upper and lower decision limits (UDL and LDL).
- Plots the means of each factor level with the upper and lower reference lines, and the center line at the grand mean.
Mean
Formula
The average of the observations at each factor level. Minitab plots the mean for each factor level on the graph.

Notation
| Term | Description |
|---|---|
| ni | number of observations at factor level i |
| yij | value of the j th observation at the i th factor level |
Grand mean (center line)
Formula
The average of all observations across factor levels. Minitab uses the grand mean as the center line on the graph.

Notation
| Term | Description |
|---|---|
| y... | sum of all observations in the sample |
| nT | total number of observations |
Standard deviation (StDev)
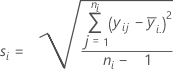
Notation
| Term | Description |
|---|---|
| yij | observations at the ith factor level |
 | mean of observations at the ith factor level |
| ni | number of observations at the ith factor level |
Pooled standard deviation
An estimate of the variation across all factor levels. The pooled standard deviation is used to calculate the decision limits.
Formula
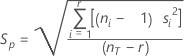
Notation
| Term | Description |
|---|---|
| r | number of levels |
| nT | total number of observations |
Upper and lower decision limits
The decision limits indicate whether factor level means are different from the grand mean. Points that lie outside the upper decision limit (UDL) or lower decision limit (LDL) are statistically different from the grand mean.
The calculation of the upper and lower decision limits varies based on the number of levels in the factor and the number of observations at each level.
Two-level factor with an equal number of observations at each level
- UDL = y.. + hα sp* Sqrt(1/ nT)
- LDL = y.. - hα sp* Sqrt(1/ nT)
where hα = absolute value (t(a / 2, nT - 2)), sp = pooled standard deviation, and nT = total number of observations.
Factor with more than 2 levels with an equal number of observations at each level
- UDL = y.. + hα sp* Sqrt[(r-1) / (rn1)]
- LDL = y.. - hα sp* Sqrt[(r-1) / (rn1)]
where r = number of levels in the factor and n1 = number of observations at each level.
The degrees of freedom are (n1- 1) * r.
For values of alpha outside the range of 0.001 and 0.1, the decision limits are:
- UDL = y.. + hα sp* Sqrt[(nT - n1) / (nT* n1)]
- LDL = y.. - hα sp* Sqrt[(nT - n1) / (nT* n1)]
where hα = absolute value (t(α2, df) and α2 = (1- (1- a )** (1 / r)) / 2 and df = nT - r.
To obtain the hα for values of α between 0.001 and 0.1 see Nelson1.
Factor with 2 or more levels with an unequal number of observations at each level
- UDLi = y.. + hα sp* Sqrt[(nT - ni) / (nT* ni)]
- LDLi = y.. - hα sp* Sqrt[(nT - ni) / (nT* ni)]
- L.S. Nelson (1983). "Exact Critical Values for Use with the Analysis of Means", Journal of Quality Technology, 15, 40-44.