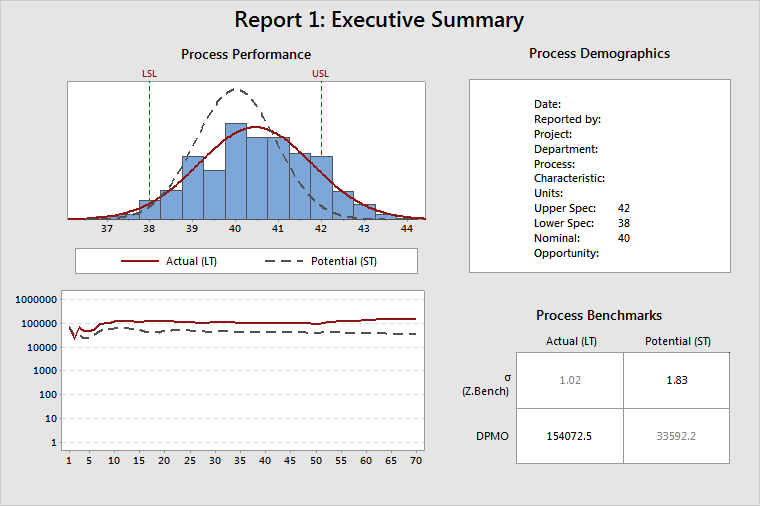
Suppose you have a process with a target of 40, a lower specification limit of 38, and an upper specification limit of 42. You collect data in subgroups of size 5. You find that your process is nearly centered on target (process mean = 40.0016 and ST standard deviation = 0.960).
You add another 20 subgroups of size 5. The mean shifts for the new subgroups to 41.5, which is approximately a 1.5 sigma shift.
Report 1: Executive Summary
The cumulative DPMO plot (bottom left) shows a problem. The cumulative ST DPMO (dashed) line flattened. The cumulative LT DPMO (solid) line appears to stabilize, but then shifts up. The LT statistics are not stable, which indicates that something in this process changed. Investigate the process to determine what changed.
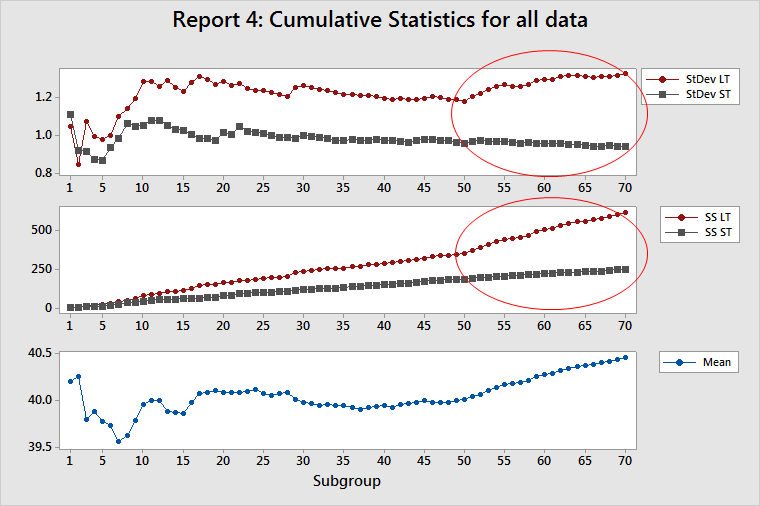
Report 4: Cumulative Statistics
- An increase in the LT standard deviation, but no increase in the ST standard deviation
- A change in slope for SS LT, but not for SS ST
- An increase in the cumulative mean
The first (top) plot on this report displays a marked increase in slope for the LT standard deviation, but no significant change in the ST standard deviation. This increase in LT standard deviation clearly occurs at subgroup 50.
The second (middle) plot shows a similar pattern for an increase in SS LT, but not for SS ST, near subgroup 50.
The third (bottom) plot also indicates a shift in process mean, but determining where the shift occurred on this plot is more difficult than on the first and second plots.
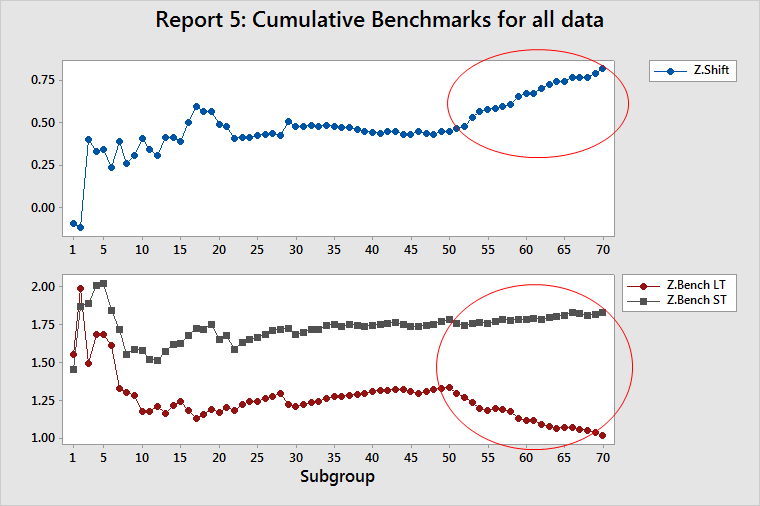
Report 5: Cumulative Benchmarks
- A reduction in capability (the process is closer to one of the specification limits)
- An increase in the LT standard deviation, but no increase in the ST standard deviation
Moving the mean closer to a specification limit causes both ST and LT capability to decrease. Increasing the LT standard deviation, as we saw in Report 4, causes the Z.LT to decrease even further. DPMO is calculated directly from the Z.Bench statistics. Thus, a dramatic change in Z.Bench LT causes a pronounced upward slope in cumulative LT DPMO. And a smaller change in Z.Bench ST causes a slight upward slope in cumulative ST PPM. For more information, go to All process capability reports for Process Report.
Because Z.Bench LT drops more than Z.Bench ST, you also see an increase in Z.Shift. This behavior occurs because the process reports are based on different processes. You need to determine which process you want to perform the analysis on: the one before the change or the one after the change. After you make that decision, collect data only from that process and rerun the analysis. If you use these reports to validate project improvements, do not include that data that was collected before the improvements.