In This Topic
PPM < LSL for Expected Overall Performance
Interpretation
Use PPM < LSL for expected overall performance to estimate the number of nonconforming items, represented in parts per million, that you can expect to be below the lower specification limit based on the overall variation of your process. Overall performance values indicate the actual process performance that your customer experiences over time.
Lower values of PPM < LSL indicate greater process capability, relative to the lower specification limit. Ideally, few or no parts have measurements that are less than the lower specification limit.
PPM > USL for Expected Overall Performance
Interpretation
Use PPM > USL for expected overall performance to estimate the number of nonconforming items, represented in parts per million, that you can expect to be above the upper specification limit based on the overall variation of your process. Overall performance values indicate the actual process performance that your customer experiences over time.
Lower values of PPM > USL indicate greater process capability, relative to the upper specification limit. Ideally, few or no parts have measurements that are greater than the upper specification limit.
PPM Total for Expected Overall Performance
Interpretation
Use PPM Total for expected overall performance to estimate the number of nonconforming items, represented in parts per million, that you can expect to be outside the specification limits based on the overall variation of your process. Overall performance values indicate the actual process performance that your customer experiences over time.
Lower values of PPM Total indicate greater process capability. Ideally, few or no parts have measurements that are outside the specification limits.
| PPM | % Nonconforming Parts | % Conforming |
|---|---|---|
| 66807 | 6.6807% | 93.3193% |
| 6210 | 0.621% | 99.379% |
| 233 | 0.0233% | 99.9767% |
| 3.4 | 0.00034% | 99.99966% |
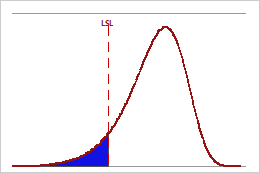
% < LSL for Expected Overall Performance
The probability that a randomly selected part is less than LSL is shown by the shaded region under the distribution curve. Interpretation
Use % < LSL for expected overall performance to estimate the percentage of nonconforming items that you can expect to be below the lower specification limit based on the overall variation of your process. Overall performance values indicate the actual process performance that your customer experiences over time.
Lower values of % < LSL indicate greater process capability, relative to the lower specification limit. Ideally, few or no parts have measurements that are less than the lower specification limit.
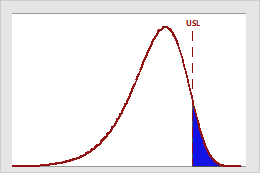
% > USL for Expected Overall Performance
Interpretation
Use % > USL for expected overall performance to estimate the percentage of nonconforming items that you can expect to be above the upper specification limit based on the overall variation of your process. Overall performance values indicate the actual process performance that your customer experiences over time.
Lower values of % > USL indicate greater process capability, relative to the upper specification limit. Ideally, few or no parts have measurements that are greater the upper specification limit.
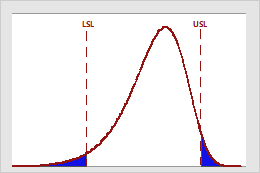
% Total for Expected Overall Performance
Interpretation
Use % Total for expected overall performance to estimate the percentage of nonconforming items that you can expect to be outside the specification limits based on the overall variation of your process. Overall performance values indicate the actual process performance that your customer experiences over time.
Lower values of % Total indicate greater process capability. Ideally, few or no parts have measurements that are outside the specification limits.