Use the uniform distribution to describe continuous variables that have a constant probability. For example, a population of parts range from 0.5 to 0.6 cm long. If every value between 0.5 and 0.6 cm has an equal likelihood of occurring, these data follow a uniform distribution.
The uniform distribution is a continuous distribution that models a range of equally likely values. The uniform distribution is specified by lower and upper end points. For example, the following graph illustrates a uniform distribution. 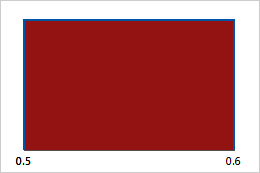
The uniform distribution does not occur often in nature, but it is important as a reference distribution. The uniform distribution is also known as the rectangular distribution.