In This Topic
Simple
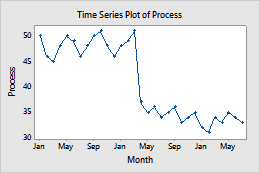
Create a time series plot that displays time-ordered values for one variable. The worksheet must include at least one column of a series of numeric or date/time data.
For example, in the following worksheet, Process contains the series data. The graph shows the energy cost of the process for each month.
| C1 |
|---|
| Process |
| 50 |
| 46 |
| 45 |
| ... |
For more information, go to Create a simple time series plot.
With Groups
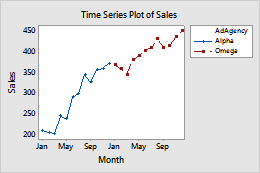
Create a time series plot that displays time-ordered values for consecutive groups. This option is helpful for representing time series data in separate stages of time. The worksheet must include at least one column of a series of numeric or date/time data, and at least one corresponding column of categorical data. Groups are defined by values in the categorical column.
For example, in the following worksheet, Sales contains the series data and AdAgency contains the categorical data. The graph shows the monthly sales for a company that used different ad agencies in each of two consecutive years. Monthly sales for the Alpha agency are represented as a separate group for the first year. Monthly sales for the Omega agency are represented as a separate group for the second year.
| C1 | C2-T |
|---|---|
| Sales | AdAgency |
| 210 | Alpha |
| 205 | Alpha |
| 202 | Alpha |
| ... | ... |
For more information, go to Create a time series plot with groups.
Multiple
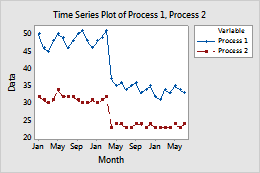
Create a plot that displays time-ordered values for multiple series. The worksheet must include multiple columns of a series of numeric or date/time data.
For example, in the following worksheet, Process 1 and Process 2 contain the series data. The graph shows the monthly energy cost of each process.
| C1 | C2 |
|---|---|
| Process 1 | Process 2 |
| 50 | 32 |
| 46 | 31 |
| 45 | 30 |
| ... | ... |
For more information, go to Create a multiple time series plot.
Multiple with Groups
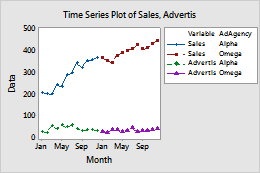
Create a plot that displays time-ordered values for multiple series with consecutive groups. The worksheet must include multiple columns of a series of numeric or date/time data, and at least one corresponding column of categorical data.
For example, in the following worksheet, Sales and Advertise contain the series data, and AdAgency contains the categorical data. The graph shows the monthly sales and advertising expenses, first for the Alpha agency and then for the Omega agency.
| C1 | C2 | C3-T |
|---|---|---|
| Sales | Advertise | AdAgency |
| 210 | 30 | Alpha |
| 205 | 25 | Alpha |
| 202 | 55 | Alpha |
| ... | ... | ... |
For more information, go to Create a multiple time series plot with groups.