In Graph variables, enter one or more numeric or date/time columns that you want to graph. Minitab creates a separate graph for each column.
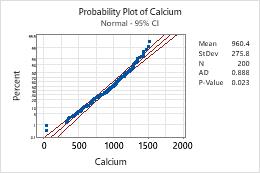
In this worksheet, Calcium is the graph variable. The graph shows the distribution of calcium amounts.
| C1 |
|---|
| Calcium |
| 646.72 |
| 1120.67 |
| 1067.25 |
| ... |
Note
For information on how to specify different distributions and parameters, go to Fitted distribution lines.