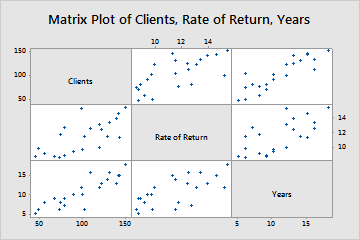
A business analyst wants to study 22 successful small-to-medium size manufacturing companies. The analyst collects data on the number of clients, rate of return, sales, and the years the companies have been in business.
As part of the initial investigation, the analyst creates a matrix plot to examine the relationships between number of clients, rate of return, and years.
- Open the sample data, BusinessMetrics.MWX.
- Choose .
- In Graph variables, enter Clients, 'Rate of Return', and Years.
- Click OK.
Interpret the results
The matrix of plots shows possible positive relationships between all of the variables: number of clients, rate of return, and number of years in business.