Complete the following steps to specify the data for your graph.
- In Y variable, enter the column that you want to explain or predict.
- In X variable, enter a corresponding column that might explain changes in the Y variable.
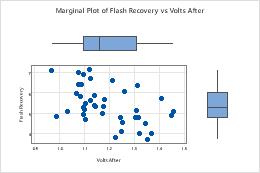
In this worksheet, Flash Recovery is the Y variable and Volts After is the X variable. The plot shows the relationship between Volts After and Flash Recovery.
| C1 | C2 |
|---|---|
| Volts After | Flash Recovery |
| 1.342 | 4.49 |
| 1.449 | 4.89 |
| 1.103 | 4.69 |
| ... |