A quality engineer wants to compare chromatogram profiles for samples of gasoline at various octanes. An irregular profile indicates possible quality problems. The engineer tests samples of nine octane ratings and records the values for 36 different components.
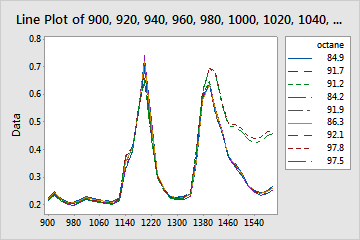
The engineer creates a line plot without symbols to compare the response patterns of the samples of different octanes.
- Open the sample data, GasolineFormulations.MWX.
- Choose .
- In Graph variables, enter 900 - 1600.
- In Label column (optional), enter octane.
- From Series Arrangement, select Each row forms a series.
- Click OK.
Interpret the results
The similar chromatogram profiles suggest consistency among the samples of different octane fuels. To identify the lines that do differ, in Minitab, hold the pointer on the line and view the tooltip.