In This Topic
Simple
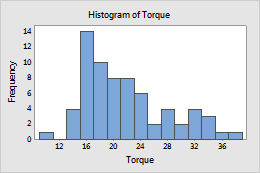
Create a histogram that displays the distribution of values for one variable. For example, the following histogram shows the distribution of the amount of torque that is required to remove the caps from a sample of shampoo bottles.
For more information, go to Create a simple histogram.
With Fit
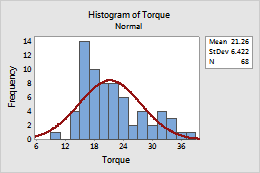
Create a histogram that displays the distribution of values for one variable and overlays a fitted distribution curve. For example, the following histogram shows the distribution of the amount of torque that is required to remove the caps from a sample of shampoo bottles with an overlaid fitted normal curve.
For more information, go to Create a histogram with a fitted distribution line.
With Groups
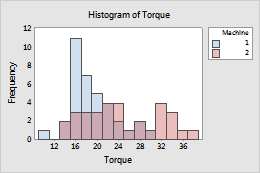
Create a histogram that displays the distribution of values, divided into groups. For example, the following histogram shows the distribution of the amount of torque that is required to remove the caps from a sample of shampoo bottles, by the machine that tightened the caps.
For more information, go to Create a histogram with groups.
With Fit and Groups
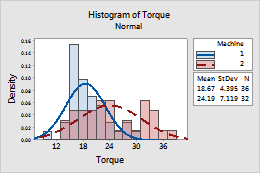
Create a histogram that displays the distribution of values, divided into groups, and overlays a fitted distribution curve for each group. For example, the following histogram shows the distribution of the amount of torque that is required to remove the caps from a sample of shampoo bottles, by the machine that tightened the caps, with overlaid fitted normal curves.
For more information, go to Create a histogram with a fitted distribution line and groups.