About smoother lines
Smoother lines are most useful when the curvature of the relationship does not change sharply. Smoother lines added to graphs are calculated using the lowess smoothing method.
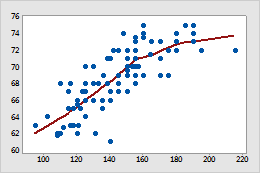
Scatterplot with a smoother line
In this time series plot, one smoother line is solid and the other smoother line is dashed.
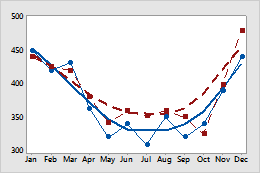
Time series plot with smoother lines for each group
- Lowess smoothing parameters
-
- Degree of smoothing
- You can enter values between 0 and 1. A lowess smoother generally works best when the fraction (f) of points is large enough to give a smooth fit without distorting the underlying relationship between the variables. Cleveland1 suggests that you make f as large as possible, but maintain unrelatedness in a separate lowess plot of the y-value residuals versus the x-values.
- Number of steps
- To limit the influence of outliers on the smoothed y-values, you can set the number of iterations of smoothing. You can enter values from 0 to 10. Each step reduces the weights given to outliers in the next iteration of weighted linear regression, based on the size of residuals in the previous lowess step. Cleveland suggests that two robust steps adequately smooth outlier effects for most data.
Add a smoother line when you create a graph
- Scatterplot
- Matrix plot
- Time series plot
- Histogram
- On the graph creation dialog, click Data View.
- Click Smoother.
- Click Lowess.
- (Optional) In Degree of smoothing, enter a number between 0 and 1 for the fraction of the total number of points to use to calculate the fitted values at each x-value. The default is 0.5. The smaller the degree of smoothing, the more the smoother tends to follow smaller patterns in the data. The larger the degree of smoothing, the more the smoother tends to follow the overall pattern in the data.
- (Optional) In Number of steps, enter a number from 0 to 10 to specify the number of iterations of smoothing to use to limit the effect of outliers. Each step reduces the weight given to outliers in the next iteration. The default is 2.
- Click OK.
Add a smoother line to a graph
You can add a lowess smoother line to scatterplots, matrix plots, histograms, and time series plots.
- Double-click the graph.
- Right-click the graph and choose .
- (Optional) In Degree of smoothing, enter a number between 0 and 1 for the fraction of the total number of points to use to calculate the fitted values at each x-value. The default is 0.5. The smaller the degree of smoothing, the more the smoother tends to follow smaller patterns in the data. The larger the degree of smoothing, the more the smoother tends to follow the overall pattern in the data.
- (Optional) In Number of steps, enter a number from 0 to 10 to specify the number of iterations of smoothing to use to limit the effect of outliers. Each step reduces the weight given to outliers in the next iteration. The default is 2.
- Click OK.
Edit a smoother line on a graph
After a smoother line is added to a graph, you can change its color, size, type, and parameters.
- Double-click the graph.
- Double-click the smoother line to edit. For more information on selecting smoother lines, go to Select groups and single items on a graph.
-
Select the tab to make the edits that you want.
- Attributes: Change the color, size, and type of line.
- Groups: Assign attributes with a grouping variable.
- Options: Change the degree of smoothing and number of steps for the smoother.
- Click OK.
Lowess method
The lowess smoothing method is a common technique for determining a smoothing line. Lowess stands for locally-weighted scatterplot smoother. You can specify parameters to modify both the degree of smoothing and the effect of outliers.
The lowess routine calculates a new, smoothed y-value for each x-value.
-
The routine selects a fraction (default f = 0.5) of all points, using the data closest in x-value on either side of the (x,y) point. This fraction is called the degree of smoothing. The selection often results in more points selected from one side of the x-value than the other. The following example shows the fraction of data selected for a given point. The shaded area holds the 0.5 fraction closest to the solid red data point.
-
Minitab calculates weights using the x-distance between each point in the selected fraction and the point to be smoothed:

The following graph shows the relationship between the weights (vertical axis) and the x-values (horizontal axis) for the fraction of selected points. Points closest to each x-value have the greatest weight in the smoothing.
-
Minitab performs a weighted linear regression on all points in the selected fraction of the data, using the weights from step 2 to produce an initial smoothed value.
-
Finally, Minitab limits the influence of outliers on the results by using further iterations (default n = 2) of step 3 with new weights calculated as follows:
