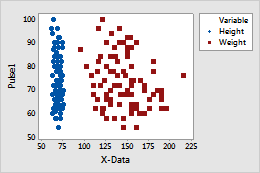
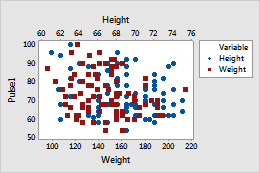
If you display multiple x variables or multiple y variables on the same graph, then you can add a secondary scale. For example, on the original scatterplot below, the x variables (Height and Weight) share the same x-scale. The variables have different ranges, which makes the data values for Height difficult to interpret. If you assign one variable to a secondary scale with its own range, then the data values for each variable are easier to read.
Original x-axis
x-axis with secondary scale
To add a secondary scale for one or more variables, use the following steps:
Double-click the graph.
Double-click the scale to open the Edit
Scale dialog box.
On the Secondary tab, choose the variable to use for the secondary scale.