In Series, enter multiple columns of time-ordered numeric or date/time data that you want to appear on the plot.
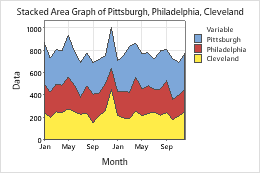
In this worksheet, Pittsburgh, Philadelphia and Cleveland are the series. The graph shows the monthly sales of a major retail chain at three stores over two years.
| C1 | C2 | C3 |
|---|---|---|
| Pittsburgh | Philadelphia | Cleveland |
| 370 | 255 | 248 |
| 304 | 225 | 202 |
| 310 | 245 | 251 |
| ... | ... | ... |