A quality engineer plans a designed experiment to study the transparency of a plastic part. Before conducting the experiment, the engineer wants to ensure that the experiment will have adequate power. The engineer plans to examine 5 numeric factors. For a base design, the engineer selects a design with 8 experimental runs and 3 center points. The engineer wants to be able to detect an effect of 5 transparency units with no more than 4 replicates. Previous experimentation indicates that 4.5 is an adequate estimate of the standard deviation. The engineer decides to calculate the power for a model with main effects and a term for center points.
- Choose .
- In Number of factors, enter 5.
- In Number of corner points, enter 8.
- In Replicates, enter 1 2 3 4.
- In Effects, enter 5.
- In Number of center points per block, enter 3.
- In Standard deviation, enter 4.5.
- Click Design.
- In Number of terms omitted from model, enter 2.
- Click OK in each dialog box.
Interpret the results
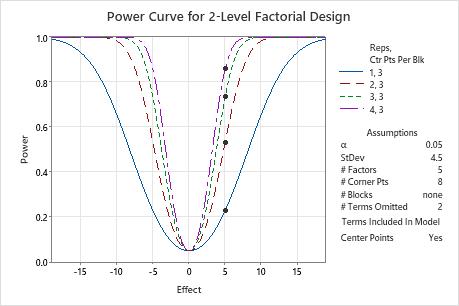
The unreplicated design has a power of approximately 23%. With 4 replicates and 35 total runs, the design has nearly an 86% chance to detect an important effect. The power curve displays a curve for each combination of replicates and center points. The symbols on the curves represent the effect size of 5 that the engineer specified. The engineer decides to use the 4 replicate design so that the power is as high as possible.
Method
| Factors: | 5 | Base Design: | 5, 8 |
|---|---|---|---|
| Blocks: | none |
Results
| Center Points | Effect | Reps | Total Runs | Power |
|---|---|---|---|---|
| 3 | 5 | 1 | 11 | 0.229128 |
| 3 | 5 | 2 | 19 | 0.533156 |
| 3 | 5 | 3 | 27 | 0.735391 |
| 3 | 5 | 4 | 35 | 0.858431 |