In This Topic
P-value for the exact method
Minitab uses the binomial distribution to calculate the p-value for samples up to size 50 (n ≤ 50). For a sample size n (after omitting any observations that are equal to the hypothesized median value) and a probability of occurrence of p = 0.5 under the null hypothesis, the calculation of the p-value depends on the alternative hypothesis.
| Alternative hypothesis | P-value |
|---|---|
| H1: Median > Hypothesized median |  |
| H1: Median < Hypothesized median |  |
| H1: Median ≠ Hypothesized median |  |
Notation
| Term | Description |
|---|---|
| n | the observed number of data points after omitting any observations that are equal to the hypothesized median value |
| s | the observed number of data points that are greater than the hypothesized median |
| S | a random variable that follows a binomial distribution with n trials and a 0.5 probability of an event, B(n, 0.5) |
| k |  |
P-value for the normal approximation method
Minitab uses a normal approximation to the binomial distribution to calculate the p-value for samples that are larger than 50 (n > 50). Specifically:
 is approximately distributed as a normal distribution with a mean of 0 and a standard deviation of 1, N(0,1).
where S, the number of observations that are above the median, has the binomial distribution with n as the number of trials and p = 0.5 as the probability of success under the null hypothesis, B(n, 0.5).
The normal approximation p-value for the three alternative hypotheses uses a continuity correction of 0.5.
| Alternative hypothesis | P-value |
|---|---|
| H1: Median > Hypothesized median | 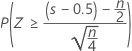 |
| H1: Median < Hypothesized median | 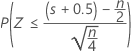 |
| H1: Median ≠ Hypothesized median | 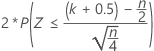 |
Notation
| Term | Description |
|---|---|
| n | the observed number of data points after omitting any observations that are equal to the hypothesized median value |
| s | the observed number of data points that are greater than the hypothesized median |
| S | a random variable that has the binomial distribution with n as the number of trials and p = 0.5 as the probability of a success, B(n, 0.5) |
| k |  |
Confidence interval
Procedure
- Minitab orders the observations such that X(1)< X(2)< ... < X(n), where X(i ) is the ith smallest observation.
- For the specified confidence level (γ), the first interval is the closest exact interval with confidence ≤ γ. The third interval is the closest exact interval with confidence ≥ γ. Let d be the largest integer such that,
- P (B < d) < (1 – γ) / 2.
B has a binomial distribution with parameters sample size n and probability of occurrence p = 0.5.
- The first interval is from X(d + 1) to X(n – d) and the third interval is from X(d ) to X(n – d + 1).
- Minitab calculates the middle confidence interval by a nonlinear interpolation (NLI) procedure that was developed by Hettmansperger and Sheather1. Let γd + 1 be the confidence level of the first interval, and γd be the confidence level of the third interval.

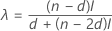
The lower endpoint of the interpolation interval is given by:
- X(d) + λ (X(d + 1)– X(d))
The upper endpoint is given by:
- X(n – d + 1)– λ (X(n – d + 1)– X(n – d))