In This Topic
Enter your data
Complete the following steps to specify the columns of data that you want to analyze.
- In Response (Y), enter the column of numeric data that you want to explain or predict. The response is also called the Y variable.
- In Predictor (X), enter a column of numeric data that may explain or predict changes in the response. The predictor is also called the X variable.
In this worksheet, Sales price is the response and contains the sales price of 3-year old cars of the same make and model. Mileage is the predictor and may explain differences in the sales price.
| C1 | C2 |
|---|---|
| Mileage | Sales price |
| 9980 | 19999 |
| 34212 | 17999 |
| 26870 | 19009 |
| 46321 | 17199 |
| 16780 | 19499 |
| 50021 | 14999 |
Type of Regression Model
The type of model you select corresponds to the equation used to fit the data. If you are not sure which model is best, start with the linear model and evaluate how well it fits the data. If there appears to be curvature in the data, repeat the analysis with a quadratic or cubic model.
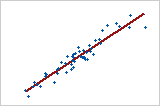
- Linear
- A linear model can show a steady rate of increase or decrease in the data. The linear model corresponds to the equation: Y = bo + b1X.
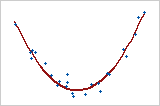
- Quadratic
- A quadratic model can account for curvature in the data. The quadratic model corresponds to the equation: Y = bo + b1X + b2X2.
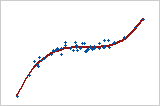
- Cubic
- A cubic model can describe a "peak-and-valley" pattern in the data. The cubic model corresponds to the equation: Y = bo + b1X + b2X2 + b3 X3.