Assume that
and
are two predictor variables. Minitab provides two measures of the strengths of
interactions. The measures come from the training data. The first measure
describes the strength of the interaction as a percentage of the total response
squared deviation:
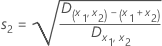
The second measure describes the strength of the interaction as a percentage
of the response squared deviation from the variables in the interaction:
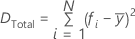
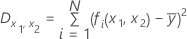
From the training data, the total squared deviation of the response surface
is as follows:
where
N is the number of rows in the training data,
is the fitted value from the TreeNet model and
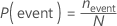
has the following definition:
where
is the number of events in the training data.
The calculation for the deviation of the interaction requires the
calculation of the deviation for both variables jointly. The joint calculation
for the deviations has the following form:
 and
and  are two predictor variables. Minitab provides two measures of the strengths of
interactions. The measures come from the training data. The first measure
describes the strength of the interaction as a percentage of the total response
squared deviation:
are two predictor variables. Minitab provides two measures of the strengths of
interactions. The measures come from the training data. The first measure
describes the strength of the interaction as a percentage of the total response
squared deviation: 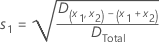
 is the fitted value from the TreeNet model and
 has the following definition:
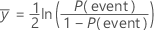
 is the number of events in the training data.
 is the fitted value from a bivariate partial dependence surface. For the
calculation of this fitted value, go to
Methods and formulas for partial dependence plots in Fit Model and Discover Key Predictors with TreeNet® Classification.
is the fitted value from a bivariate partial dependence surface. For the
calculation of this fitted value, go to
Methods and formulas for partial dependence plots in Fit Model and Discover Key Predictors with TreeNet® Classification.
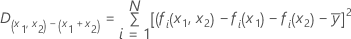
 and
and  are fitted values from univariate partial dependence surfaces for
 and
and  .
For the calculation of these fitted values, go to
Methods and formulas for partial dependence plots in Fit Model and Discover Key Predictors with TreeNet® Classification.
.
For the calculation of these fitted values, go to
Methods and formulas for partial dependence plots in Fit Model and Discover Key Predictors with TreeNet® Classification.