Overview
- The tree that Minitab selects is part of a pattern where the criterion improves. One or more trees that have a few more nodes are part of the same pattern. Typically, you want to make predictions from a tree with as much prediction accuracy as possible.
- The tree that Minitab selects is part of a pattern where the criterion is relatively flat. One or more trees with similar model summary statistics have much fewer nodes than the optimal tree. Typically, a tree with fewer terminal nodes gives a clearer picture of how each predictor variable affects the response values. A smaller tree also makes it easier to identify a few target groups for further studies. If the difference in prediction accuracy for a smaller tree is negligible, you can also use the smaller tree to evaluate the relationships between the response and the predictor variables
- The analyst chooses a smaller tree that provides a clearer view of the most important variables.
- The analysis chooses a tree because the splits are on variables that are easier to measure than the variables in another tree.
- The analyst chooses a tree because a particular terminal node is of interest.
Perform the analysis
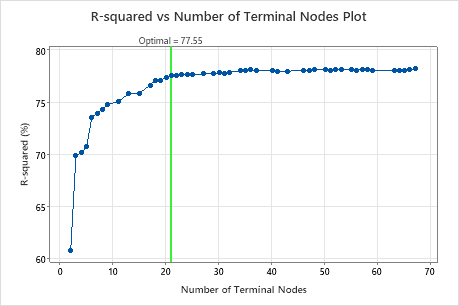
Click Select Alternative Tree in the output. A dialog box opens that shows the plot of the criterion against the number of terminal nodes, a tree diagram, and a table that summarizes the tree or the selected node.
Compare criteria
- Click a point on the graph.
- Click the arrow buttons at the bottom right of the graph to select a tree that is one tree larger or smaller than the current selection.
- Click a button to select a
tree that is a common choice. The choices depend on whether the criterion for
the optimal tree is the least squared error or the least absolute deviation.
When the analysis does not use validation, the buttons that refer to the
standard error do not apply.
- Least squared error
- Max R-squared
- Select the tree with the largest R2 value on the plot.
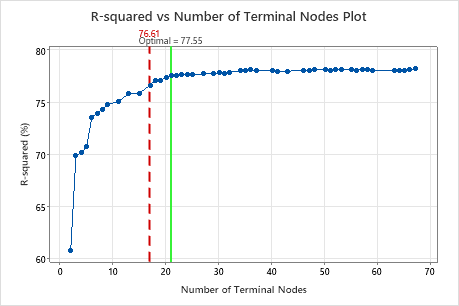
- 1-SE Max R-sq
- Select the smallest tree that has an R2 value within one standard error of the largest R2 value.
- 2-SE Max R-sq
- Select the smallest tree that has an R2 value within 2 standard errors of the largest R2 value.
- Least absolute deviation
- Min MAD
- Select the tree with the smallest Mean Absolute Deviation (MAD) value on the plot.
- 1-SE MAD
- Select the smallest tree that has an MAD value within one standard error of the smallest MAD value.
- 2-SE MAD
- Select the smallest tree that has an MAD value within 2 standard errors of the smallest MAD value.
Investigate the tree and nodes
- Highlight the 5 nodes with the least variation from the fitted value for the node. These nodes are the optimal nodes.
- Highlight the 5 nodes with the highest means or medians, depending on the criterion for the tree.
- Highlight the 5 nodes with the lowest means or medians, depending on the criterion for the tree.
- Switch between the Detailed Tree and the Node Split Tree. The Node Split Tree is helpful when you have a large tree and want to see only which variables split the nodes.
- Zoom in and out on the tree.
You can select individual nodes on the tree to see details about the node in the table. The details include the mean if the criterion is the maximum R2 and the median if the criterion is the least absolute deviation. The details also include the standard deviation of the node and the rules to arrive at the node. Click Copy rules to clipboard so that you can paste the rules in another place.
To reselect the entire tree, click anywhere in the diagram that is not an individual node.
Create a new tree
Click Create Tree to create and store results for an alternative tree that you choose. The selections for results and storage are the same as for the original tree. The graphs and tables for the alternative tree are in a new output tab. The stored columns are in the worksheet with the original data.