What is Analysis of Means?
Analysis of means is a graphical alternative to ANOVA that tests the equality of population means. The graph displays each factor level mean, the overall mean, and the decision limits. If a point falls outside the decision limits, then evidence exists that the factor level mean represented by that point is significantly different from the overall mean.
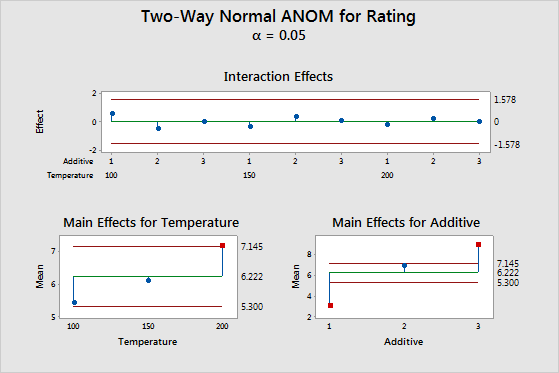
The top plot shows that the interaction effects are well within the decision limits, signifying no evidence of interaction. The lower two plots show the means for the levels of the two factors, with the main effect being the difference between the mean and the center line. In the lower left plot, the point representing the third mean of the factor Temperature is displayed by a red symbol, indicating that there is evidence that the Temperature 200 mean is significantly different from the overall mean at α = 0.05. The main effects for levels 1 and 3 of the Additive factor are well outside the decision limits of the lower right plot, signifying that there is evidence that these means are different from the overall mean.
Comparison of Analysis of Means (ANOM) and ANOVA
ANOVA tests whether the treatment means differ from each other. ANOM tests whether the treatment means differ from the overall mean (also called the grand mean).
- If one group of means is above the overall mean and a different group of means is below the overall mean, ANOVA might indicate evidence for differences where ANOM might not.
- If the mean of one group is separated from the other means, the ANOVA F-test might not indicate evidence for differences whereas ANOM might flag this group as being different from the overall mean.
One more important difference is that ANOVA assumes that your data follow a normal distribution, while ANOM can be used with data that follows a normal, binomial, or Poisson distribution.