Use Interaction Plot to show how the relationship between one categorical factor and a continuous response depends on the value of the second categorical factor. This plot displays means for the levels of one factor on the x-axis and a separate line for each level of another factor.
- Parallel lines
- No interaction occurs.
- Nonparallel lines
- An interaction occurs. The more nonparallel the lines are, the greater the strength of the interaction.
Although you can use this plot to display the effects, be sure to perform the appropriate ANOVA test and evaluate the statistical significance of the effects. If the interaction effects are significant, you cannot interpret the main effects without considering the interaction effects.
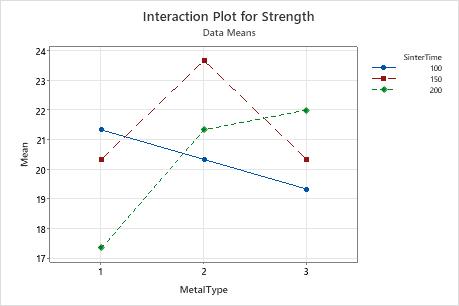
In this interaction plot, the lines are not parallel. This interaction effect indicates that the relationship between metal type and strength depends on the value of sinter time. For example, if you use MetalType 2, SinterTime 150 is associated with the highest mean strength. However, if you use MetalType 1, SinterTime 100 is associated with the highest mean strength.
The general linear model results indicate that the interaction between SinterTime and MetalType is significant.