A process engineer wants to evaluate the glass refractive measurement system for a glass manufacturing process. The engineer asks three operators to measure the refractive properties of 22 glass parts at two stations.
Because this study has a fixed factor (station), the engineer performs an expanded gage R&R study to assess the variability in measurements that may be from the measurement system.
- Open the sample data, GlassRefraction.MWX.
- Choose .
- In Part numbers, enter Part.
- In Operators, enter Operator.
- In Measurement data, enter Measurement.
- In Additional factors, enter Station.
- In Fixed factors, enter Station.
- Click the Terms button.
- From Include terms in the model up through order, select 2.
- Under Selected terms, remove the Part*Station interaction term from the model.
- Click OK in each dialog box.
Interpret the results
The first two-way ANOVA table includes terms for the part, the operator, the fixed factors, and the interactions. If the p-value for an interaction is ≥ 0.05, Minitab omits the interaction from the full model because it is not significant. In this example, the Part*Operator p-value is 0.189, and the Operator*Station p-value is 0.598. Thus, Minitab generates a second two-way ANOVA table that omits these interactions from the final model.
For the refraction data, the measurement system (Total Gage R&R %Contribution, approximately 49%) has as much variability as the parts (Part-to-Part %Contribution, approximately 51%). The Total Gage R&R equals approximately 70% of the study variation. Repeatability is approximately 69% of the study variation, which indicates that the measurement system does not measure the same part consistently.
This process can distinguish only 1 distinct category, which indicates that the measurement system cannot distinguish between parts. For more information, go to Using the number of distinct categories in a gage R&R study.
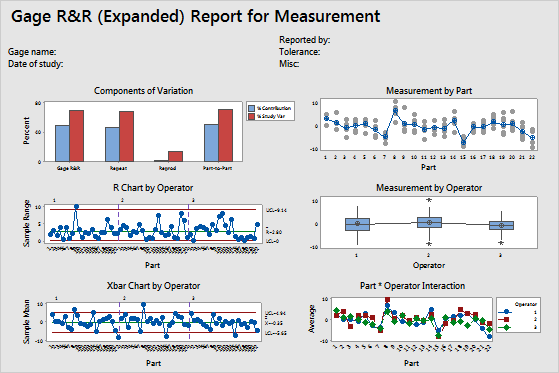
- In the Components of Variation graph, you can see that measurement system explains about the same amount of variation as the part-to-part variation. Specifically, most of the variability is from the inaccuracy of the measurement system (Repeatability).
- In the R Chart by Operator, several of the data points are out-of-control, which indicates that the three operators measure inconsistently.
- In the Xbar Chart by Operator, only a few points are beyond the control limits for each operator. For this chart, at least 50% of the points should be out of control to indicate an acceptable measurement system. Thus, in this example, the Xbar Chart indicates a measurement system that might not be acceptable.
- In the By Part graph, the measurements of each part vary noticeably. This variability might be due to the inaccuracy of the measurement system. The averages also vary noticeably, which is desirable because the parts used in the study should represent the entire range of possible parts.
- In the By Operator graph, the measurements for each operator vary by approximately the same amount. Some variation is always present, but the data indicate that the operators measure similarly.
- In the Operator*Part Interaction graph, the lines follow each other closely. However, some inconsistencies are present. For example, Operator 3 seems to have different measurements for part 19 than the other two operators.
Factor Information
| Factor | Type | Levels | Values |
|---|---|---|---|
| Part | Random | 22 | 1, 2, 3, 4, 5, 6, 7, 8, 9, 10, 11, 12, 13, 14, 15, 16, 17, 18, 19, 20, 21, 22 |
| Operator | Random | 3 | 1, 2, 3 |
| Station | Fixed | 2 | 1, 2 |
ANOVA Table with All Terms
| Source | DF | Seq SS | Adj SS | Adj MS | F-Value | P-Value | |
|---|---|---|---|---|---|---|---|
| Part | 21 | 1071.30 | 1071.30 | 51.014 | 6.46 | 0.000 | |
| Operator | 2 | 32.18 | 32.18 | 16.089 | 3.27 | 0.164 | x |
| Station | 1 | 11.25 | 11.25 | 11.247 | 3.50 | 0.202 | |
| Part*Operator | 42 | 331.81 | 331.81 | 7.900 | 1.27 | 0.189 | |
| Operator*Station | 2 | 6.43 | 6.43 | 3.217 | 0.52 | 0.598 | |
| Repeatability | 63 | 390.53 | 390.53 | 6.199 | |||
| Total | 131 | 1843.50 |
ANOVA Table with Terms Used for Gage R&R Calculations
| Source | DF | Seq SS | Adj SS | Adj MS | F-Value | P-Value |
|---|---|---|---|---|---|---|
| Part | 21 | 1071.30 | 1071.30 | 51.014 | 7.49 | 0.000 |
| Operator | 2 | 32.18 | 32.18 | 16.089 | 2.36 | 0.099 |
| Station | 1 | 11.25 | 11.25 | 11.247 | 1.65 | 0.202 |
| Repeatability | 107 | 728.77 | 728.77 | 6.811 | ||
| Total | 131 | 1843.50 |
Variance Components
| Source | VarComp | %Contribution (of VarComp) |
|---|---|---|
| Total Gage R&R | 7.1070 | 49.10 |
| Repeatability | 6.8109 | 47.06 |
| Reproducibility | 0.2961 | 2.05 |
| Operator | 0.2109 | 1.46 |
| Station | 0.0852 | 0.59 |
| Part-To-Part | 7.3672 | 50.90 |
| Part | 7.3672 | 50.90 |
| Total Variation | 14.4743 | 100.00 |
Gage Evaluation
| Source | StdDev (SD) | Study Var (6 × SD) | %Study Var (%SV) |
|---|---|---|---|
| Total Gage R&R | 2.66590 | 15.9954 | 70.07 |
| Repeatability | 2.60978 | 15.6587 | 68.60 |
| Reproducibility | 0.54413 | 3.2648 | 14.30 |
| Operator | 0.45921 | 2.7552 | 12.07 |
| Station | 0.29189 | 1.7514 | 7.67 |
| Part-To-Part | 2.71427 | 16.2856 | 71.34 |
| Part | 2.71427 | 16.2856 | 71.34 |
| Total Variation | 3.80450 | 22.8270 | 100.00 |