In This Topic
VarComp for ANOVA method
Variance component contributed by each source.
With the interaction term
When the Operator*Part interaction is included in the ANOVA model, the variance components are calculated as follows:
If a variance component is negative, then Gage R&R will report it as zero.
- Repeatability
-
Repeatability = MSRepeatability
- Operator
-

- Operator*Part
-

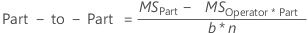
- Part-to-Part
-
- Reproducibility
- Reproducibility = VarCompOperator +VarCompOperator*Part
- Total Gage R&R
- Total Gage R&R = VarCompRepeatability + VarCompReproducibility
- Total Variation
- Total Variation = VarCompTotal Gage R&R + VarCompPart-to-Part
Without the interaction term
When Operator*Part interaction is not included in the ANOVA model, the variance components are calculated as follows:
- Repeatability
-
Repeatability = MSRepeatability
- Operator
-

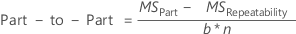
- Part-to-Part
-
- Reproducibility
- Reproducibility = VarCompOperator
- Total Gage R&R
- Total Gage R&R = VarCompRepeatability + VarCompReproducibility
- Total Variation
- Total Variation = VarCompTotal Gage R&R + VarCompPart-to-Part
Variance for Xbar and R method
Variance contributed by each source.
- Repeatability
- Equipment variation, the standard deviation is calculated as:
-
- Reproducibility
-
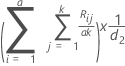
Operator variation, the standard deviation is calculated as:

-
Term Description 
the average measurement for operator i a number of parts r number of trials d2 d2 = d2* from Appendix C1. When looking for this value, use g = 1 and m = (# of operators). - Part-to-Part
-
The standard deviation is calculated as:

- Total Gage R&R
-
The standard deviation is calculated as:

- Total Variation
-
The standard deviation is calculated as:

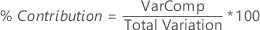
%Contribution
%Contribution is the percentage of overall variation from each variance component. It is calculated as the variance component for each source divided by the total variation, then multiplied by 100 to express as a percentage. %Contribution is calculated by dividing each variance component by the total variation and multiplying by 100. The percentages in this column add to 100.
StdDev
StdDev (SD) is the standard deviation for each source of variation. The standard deviation is equal to the square root of the variance component for that source.
- If
 then the total standard deviation is σ and
  .
. - Otherwise Minitab uses the data to estimate the total standard deviation and
 .
.
| Term | Description |
|---|---|
 | historical standard deviation |
 | total gage standard deviation calculated from the data |
 | part-to-part standard deviation |
Study Var
The study variation is calculated as the standard deviation for each source of variation multiplied by 6 or the multiplier that you specify in Study variation.
Usually, process variation is defined as 6s, where s is the standard deviation as an estimate of the population standard deviation (denoted by σ or sigma). When data are normally distributed, approximately 99.73% of the data fall within 6 standard deviations of the mean. To define a different percentage of data, use another multiplier of standard deviation. For example, if you want to know where 99% of the data fall, you would use a multiplier of 5.15, instead of the default multiplier of 6.
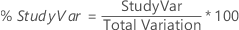
%Study Var and CI
The %study variation is calculated as the study variation for each source of variation, divided by the total variation and multiplied by 100.
%Study Var is the square root of the calculated variance component (VarComp) for that source. Thus, the %Contribution of VarComp values sum to 100, but the %Study Var values do not.
Confidence interval
If L and U are the lower and upper bounds of a percent of contribution, then the confidence interval for the corresponding percent of study variation is:

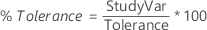
%Tolerance and CI
%Tolerance is the percent of tolerance for each component.
If the tolerance (Upper spec – Lower spec) is given, the %tolerance is calculated by dividing the Study Var for each component by the specified tolerance.
If only one specification limit is given, the percent tolerance is half the Study Var for each component divided by the one-sided tolerance. The one-sided tolerance is the absolute value of the given specification limit subtracted from the average of all the measurements.
Minitab displays this value only when you enter a process tolerance (Upper spec – Lower spec) or a specification limit in the Options subdialog box.
Confidence interval
If L and U are the lower and upper bounds of a variance component, then the confidence interval for the corresponding percent tolerance is:
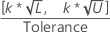
| Term | Description |
|---|---|
| k | k is the study constant and the default value is 6 |
%Process and CI
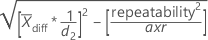
%Process is the percent of process variation, calculated by the ratio of estimated standard deviation to historical standard deviation.

Minitab displays this value only when you enter a historical standard deviation in the Options subdialog box.
Confidence interval
If L and U are the lower and upper bounds of a variance component, then the confidence interval for the corresponding process variation is:

| Term | Description |
|---|---|
| k | k is the study constant and the default value is 6 |