A quality engineer wants to monitor the variability in the tear strength, glossiness, and opacity of plastic sheets that her company manufactures. She measures four sheets a day for 10 days. Previous analyses have found that these variables are correlated.
The quality engineer creates a T2-Generalized Variance chart to simultaneously monitor the mean and variation of tear strength, glossiness, and opacity of the plastic sheets over 10 days.
- Open the sample data, PlasticSheets.MWX.
- Choose .
- In Variables, enter Tear Gloss Opacity.
- In Subgroup sizes, enter Subgroup.
- Click OK.
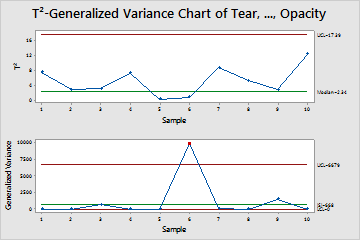
Interpret the results
The quality engineer looks at the Generalized Variance chart first. If the Generalized Variance chart shows that the process variation is not in control, then the control limits on the T2 chart are inaccurate.
The joint variation of the tear strength, glossiness, and opacity is above the upper control limit at point 6. The engineer should investigate why the variation is not in control and correct the issues before interpreting the T2 chart.