A manufacturer uses two machines to produce connector pins. A quality engineer wants to compare the process capability of each machine. The engineer randomly samples five pins per box from each machine. The specification range for the length of the pin is 13 mm to 25 mm.
The engineer performs normal capability analysis for multiple variables to evaluate how well the lengths of the connector pins meet customer requirements for the two machines.
- Open the sample data, PinLength.MWX.
- Choose .
- In Variables, enter Length.
- In Subgroup sizes, enter 5.
- Select By variables and enter Machine.
- In Lower spec, enter 13.
- In Upper spec, enter 25.
- Click OK.
Interpret the results
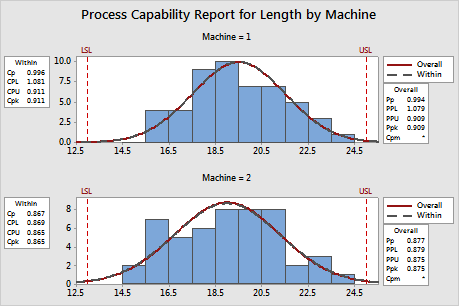
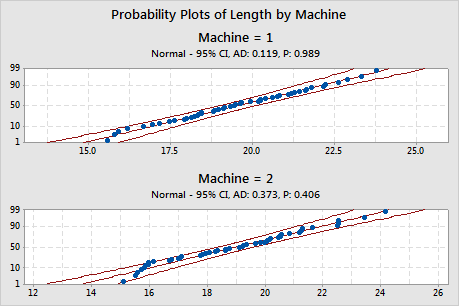
For each machine, the data appear approximately normal, and the within and overall curves are closely aligned. The process is approximately centered and the measurements are located within the specification range. The Pp for machine 1 is 0.994 and for machine 2 is 0.877, which indicates high variability for both machines. The Ppk for machine 1 is 0.909 and for machine 2 is 0.875, which indicates that the process data are too close to the specification limits. A generally accepted minimum value for Pp and Ppk is 1.33. Because the overall capability indices are less than 1.33 for both machines, the process is not capable of producing pins that conform to specifications.