What is average total inspection?
The average total inspection per lot depends on the incoming quality, the probability that the lot will be accepted, and the sample and lot sizes. When incoming quality is very good (for example, no product in the lot has a defect), then you inspect the specified sample size. When the incoming quality is very bad (for example, every product in the lot has a defect), then you resort to 100% inspection. Because the quality levels varies between lots, the average number inspected across many lots falls between 0% and 100% of the lot size.
What is an average total inspection curve?
The average total inspection (ATI) plot depicts the relationship between the quality of the incoming material and the number of items that need to be inspected, assuming that rejected lots will be 100% inspected and that a rectifying inspection of defective items will be performed. In a rectifying inspection, defective items are either removed, reworked, or replaced.
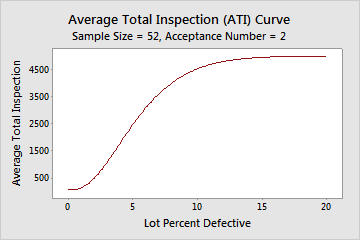
For example, your sampling plan specifies that you sample 52 pens from a shipment of 5000. If the actual % defective is 1.5%, the average total inspected per lot is 266.2 pens.
In addition to the ATI curve, you should also examine the OC curves and the AOQ curves when rectifying inspection is required.
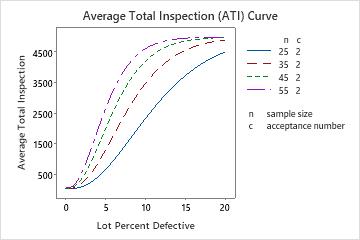
Use an ATI curve to choose an appropriate sampling plan