In This Topic
Sample size and acceptance number
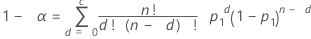
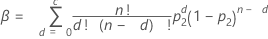
Minitab uses an algorithm to solve the following equations for n, sample size, and c, acceptance number.
Formulas
Notation
| Term | Description |
|---|---|
| α | producer's risk |
| β | consumer's risk |
| p1 | acceptable quality level (AQL) |
| p2 | rejectable quality level (RQL) or lot tolerance percent defective (LTPD) |
Note
0 < p1< p2< 1
Probability of acceptance
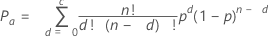
The probability of acceptance (Pa) describes the chance of accepting a particular lot based on a specific sampling plan and incoming proportion defective. It is based on the binomial distribution.
Notation
| Term | Description |
|---|---|
| c | acceptance number |
| n | sample size |
| p | fraction defective |
Probability of rejecting
The probability of rejecting (Pr) describes the chance of rejecting a particular lot based on a specific sampling plan and incoming proportion defective. It is simply 1 minus the probability of acceptance.
Pr = 1 – Pa
where:
Pa = probability of acceptance
Average outgoing quality (AOQ)
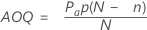
The average outgoing quality represents the quality level of the product after inspection. The average outgoing quality varies as the incoming fraction defective varies.
Notation
| Term | Description |
|---|---|
| Pa | probability of acceptance |
| p | incoming fraction defective |
| N | lot size |
| n | sample size |
Average total inspection (ATI)
The average total inspection represents the average number of units that will be inspected for a particular incoming quality level and probability of acceptance.
Notation
| Term | Description |
|---|---|
| Pa | probability of acceptance |
| N | lot size |
| n | sample size |