or
Complete the following steps to specify the data for your graph.
- In Series, enter one or more columns of time-ordered numeric or date/time data that you want to graph. By default, Minitab creates a separate graph for each variable.
- In Categorical variables for grouping (1-3), enter up to three columns of categorical data that define the groups.
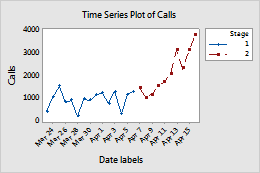
A manager tracks the number of calls that sales representatives receive during two stages of an advertising campaign. Each day, the manager records the number of calls in the Calls column and identifies the stage of the campaign in the Stage column. The Y variable is Calls and the group variable is Stage. The manager also enters the dates in the Date labels column to use as the time stamp.
| C1 | C2 | C3-T |
|---|---|---|
| Calls | Stage | Date labels |
| 428 | 1 | Mar 23 |
| 1042 | 1 | Mar 24 |
| ... | ... | ... |
| 1462 | 2 | Apr 7 |
| 1032 | 2 | Apr 8 |
| ... | ... | ... |