Complete the following steps to specify the data for your graph.
- In Y variables, enter one or more columns of Y values.
- In X variables, for each Y variable, enter a corresponding column of X values. For a scatterplot with a connect line, the X variable usually contains time or date values.
By default, Minitab creates a separate graph for each pair of X and Y variables.
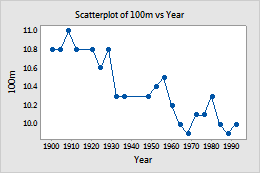
In this worksheet, 100m is the Y variable and Year is the X variable. The graph shows the winning times for a 100m race by year, with a connect line.
| C1 | C2 |
|---|---|
| Year | 100m |
| 1900 | 10.8 |
| 1904 | 10.8 |
| 1908 | 11.0 |
| ... | ... |