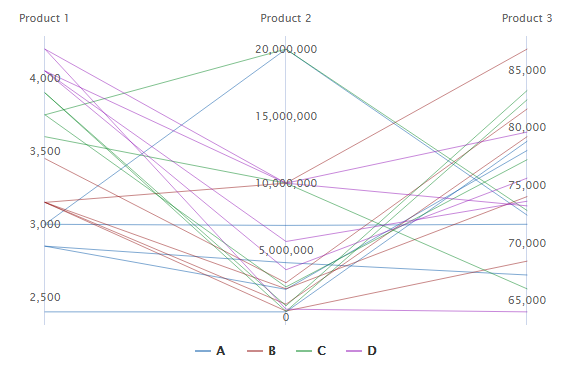
Display individual series
Create a parallel plot that displays a series for every row in the worksheet. The worksheet must include at least two columns of numeric data.
For example, the following worksheet contains the amount of three different products made by 20 different factories. Factory contains the numeric ID of the factory. Product 1, Product 2, and Product 3 contain the amounts made by each factory. The plot displays a series for each factory.
| C1 | C2 | C3 | C4 |
|---|---|---|---|
| Factory | Product 1 | Product 2 | Product 3 |
| 1 | 2400 | 400000 | 78800 |
| 2 | 2850 | 4070000 | 67200 |
| 3 | 2850 | 2080000 | 78000 |
| ... | .... | ... |
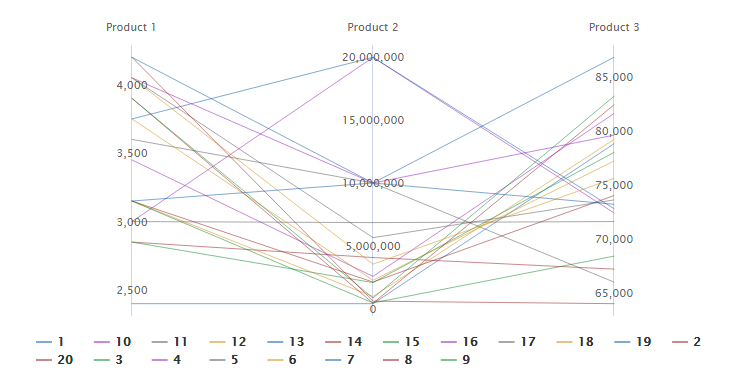
Display individual series by group
Create a parallel plot that displays a series for every row in the worksheet and uses the same color for each level of the grouping variable. The worksheet must include at least two columns of numeric data and one column that contains the groups.
For example, the following worksheet contains the amount of three different products made by 20 different factories located in four regions. Factory contains the numeric ID of the factory. Product 1, Product 2, and Product 3 contain the amounts made by each factory. Region contains the text identifier of the factory location. The plot displays a series for each factory, color coded by region.
| C1 | C2 | C3 | C4 | C5 |
|---|---|---|---|---|
| Factory | Product 1 | Product 2 | Product 3 | Region |
| 1 | 2400 | 400000 | 78800 | A |
| 2 | 2850 | 4070000 | 67200 | A |
| 3 | 2850 | 2080000 | 78000 | A |
| ... | .... | ... | ... | ... |
Display summarized groups
Create a parallel plot that displays a series for every group in the worksheet, not every row. The worksheet must include at least two columns of numeric data and one column that contains the groups.
For example, the following worksheet contains the amount of three different products made by 20 different factories located in four regions. Factory contains the numeric ID of the factory. Product 1, Product 2, and Product 3 contain the amounts made by each factory. Region contains the text identifier of the factory location. The plot displays a series for each region, not each factory. The data points are the average production of the factories in that region.
| C1 | C2 | C3 | C4 | C5 |
|---|---|---|---|---|
| Factory | Product 1 | Product 2 | Product 3 | Region |
| 1 | 2400 | 400000 | 78800 | A |
| 2 | 2850 | 4070000 | 67200 | A |
| 3 | 2850 | 2080000 | 78000 | A |
| ... | .... | ... | ... | ... |