A quality engineer for a camera manufacturer wants to shorten the flash recovery time. Flash recovery time is the least amount of time that is required between flashes. The engineer wants to determine whether a relationship exists between the voltage that remains in the camera battery immediately after a flash and the flash recovery time. The engineer also wants to determine whether there are differences in flash recovery time between old and new formulations of the battery. The engineer collects random samples of batteries made with the old and new formulations. The engineer measures the volts remaining immediately after a flash and the flash recovery time for each.
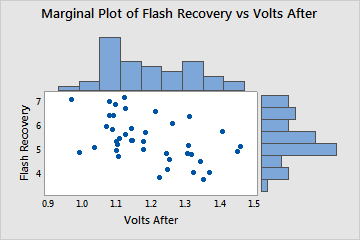
As part of the initial investigation, the engineer creates a marginal plot of flash recovery time versus volts remaining after a flash, to assess the relationship between the two variables and examine their distributions.
- Open the sample data, FlashRecoveryTime.MWX.
- Choose .
- In Y variable, enter 'Flash Recovery'.
- In X variable, enter 'Volts After'.
- Click OK.
Interpret the results
The scatterplot shows a possible negative linear relationship between the volts remaining after a flash and the flash recovery time. As the volts remaining after a flash decrease, the flash recovery time increases. The marginal distributions have clusters of points (approximately 5 for Flash Recovery and approximately 1.1 for Volts After).