With Symbols: One Y
Create a line plot that displays several series of short response patterns. The worksheet must include at least one column of numeric or date/time data and two columns of categorical data. Series are defined by values in a categorical variable.
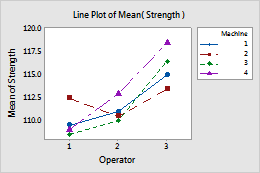
For example, the following worksheet contains the strength measurements for synthetic fibers produced on four machines by three operators. Strength contains the numeric data. Operator and Machine contain the categorical data. The graph shows a series for each machine of the strength of fibers produced by each operator.
| C1 | C2 | C3 |
|---|---|---|
| Machine | Operator | Strength |
| 1 | 1 | 109 |
| 1 | 1 | 110 |
| 2 | 1 | 110 |
| ... | .... | ... |
For more information, go to Create a line plot of one Y variable, with symbols.
With Symbols: Multiple Y’s
Create a line plot that displays several series of short response patterns. The worksheet must include several columns of numeric or date/time data one column of categorical data. Series are defined by separate columns or by values in the categorical variable.
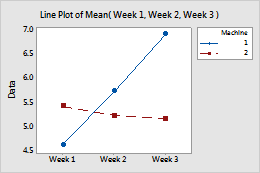
For example, the following worksheet contains the diameters of pipes produced each week for three weeks, on two machines. Week 1, Week 2, and Week 3 contain the numeric data. Machine contains the categorical data. The graph shows a series for each machine of the diameter of pipes produced each week.
| C1 | C2 | C3 | C4 |
|---|---|---|---|
| Week 1 | Week 2 | Week 3 | Machine |
| 5.19 | 5.57 | 8.73 | 1 |
| 5.53 | 5.11 | 5.01 | 2 |
| 4.78 | 5.76 | 7.59 | 1 |
| ... | ... | ... | ... |
For more information, go to Create a line plot of multiple Y variables, with symbols.
With Symbols: Series in Rows or Columns
Create a line plot that displays several series of short response patterns. The worksheet must include several columns of numeric or date/time data. The worksheet can contain one column of categorical data. Data are in a two-way table where each cell contains a summarized value for the column/row combination. Series are defined by separate columns or by separate rows.
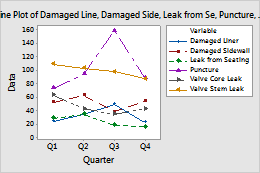
For example, the following worksheet contains the number of tires with a specific type of tire damage, per quarter. Damaged Liner, Damaged Sidewall, Leak from Seating, Puncture, Valve Core Leak, and Valve Stem Leak contain the numeric data. Quarter contains the categorical data. The graph shows a series for each damage type of the number of defective tires for each quarter.
| C1-T | C2 | C3 | C4 | C5 | C6 | C7 |
|---|---|---|---|---|---|---|
| Quarter | Damaged Liner | Damaged Sidewall | Leak from Seating | Puncture | Valve Core Leak | Valve Stem Leak |
| Q1 | 25 | 53 | 29 | 73 | 63 | 109 |
| Q2 | 34 | 63 | 35 | 94 | 43 | 103 |
| Q3 | 50 | 39 | 19 | 158 | 35 | 98 |
| Q4 | 23 | 54 | 17 | 89 | 43 | 87 |
For more information, go to Create a line plot of series in rows or columns, with symbols.
Without Symbols: One Y
Create a line plot that displays multiple series of long response patterns. The worksheet must at least one column of numeric or date/time data one column and two columns of categorical data. Series are defined by values in a categorical variable.
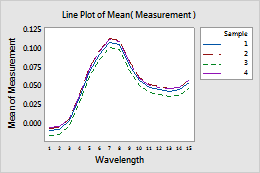
For example, the following worksheet contains near-infrared (NIR) spectral data for four samples of soybean flour. Measurement contains the numeric data. Wavelength and Sample contain the categorical data. The graph shows a series for each sample of the measurements for each wavelength.
| C1 | C2 | C3 |
|---|---|---|
| Wavelength | Measurement | Sample |
| 1 | -0.023460 | 1 |
| 1 | 0.004122 | 2 |
| 1 | -0.000544 | 3 |
| ... | ... | ... |
For more information, go to Create a line plot of one Y variable, without symbols.
Without Symbols: Multiple Y’s
Create a line plot that displays multiple series of long response patterns. The worksheet must contain multiple columns of numeric or date/time data and one column of categorical data. Series are defined by values in the categorical variable.
For example, the following worksheet contains the concentrations of nine elements in three samples of wine. Cr, Sr, Pb, and so on contain the numeric data. Sample contains the categorical data. The graph shows a series for each sample of the concentration of each element.
| C1 | C2 | C3 | C4 | ... | C10 |
|---|---|---|---|---|---|
| Cr | Sr | Pb | B | ... | Sample |
| 0.063 | 0.192 | 0.777 | 5.56 | ... | 1 |
| 0.021 | 0.172 | 0.232 | 3.79 | ... | 1 |
| 0.021 | 0.358 | 0.035 | 4.34 | ... | 1 |
| ... | ... | ... | ... | ... | ... |
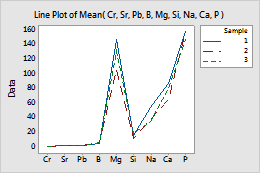
For more information, go to Create a line plot of multiple Y variables, without symbols.
Without Symbols: Series in Rows or Columns
Create a line plot that displays multiple series of long response patterns. The worksheet must include multiple columns of numeric or date/time data one column of categorical data. Data are in a two-way table where each cell contains a summarized value for the column/row combination. Series are defined by separate columns or by separate rows.
For example, the following worksheet contains the chromatogram profiles for samples of gasoline at various octanes. 900 through 1600 contain the numeric data. The octane column contains the categorical data. The graph shows the chromatogram profile for each octane of gasoline.
| C1 | C2 | C3 | ... | C37 |
|---|---|---|---|---|
| 900 | 920 | 940 | ... | octane |
| 0.213751 | 0.236162 | 0.211233 | ... | 84.9 |
| 0.221843 | 0.241514 | 0.216588 | ... | 91.7 |
| 0.220893 | 0.241153 | 0.215574 | ... | 91.2 |
| ... | ... | ... | ... | ... |
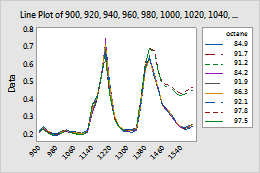
For more information, go to Create a line plot of series in rows or columns, without symbols.