Complete the following steps to specify the data for your graph.
- From Display, select how you want to display the heatmap.
- Select Function of a variable to display the mean or other function of a variable divided into groups. The worksheet must include at least one column of numeric or text data and corresponding column of categorical data.
- Select Counts of unique values to display counts of unique values for one variable. The worksheet must include at least one column of categorical data.
- If you select Function
of a variable, complete the following steps:
- In Graph variables, enter a numeric or text column that defines the color gradient of the rectangles in the heatmap.
- From Function, select the function of the Graph variables. For example, if you select Maximum, Minitab defines the color gradient for the heatmap based on the maximum value of the Graph variables in each rectangle. Some options require you to enter additional values. For more information, go to Select the function.
- In Row variables and Column variables, enter up to five columns of categorical variables. You must enter at least one column in either field. The columns can be text or numeric and must be the same length as the column you enter in Graph variables.
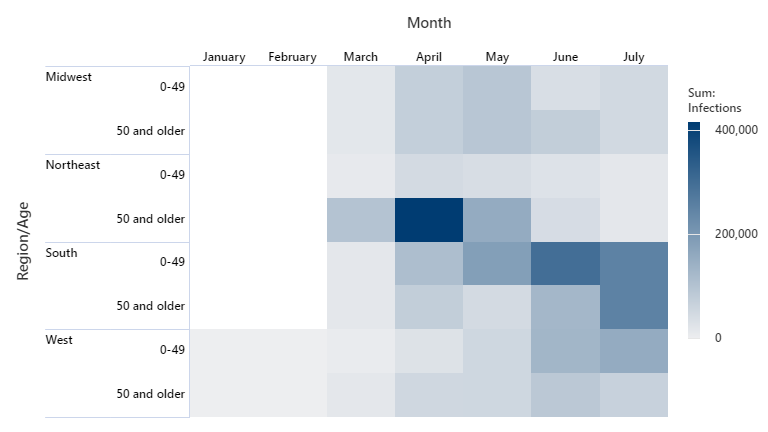
In this worksheet, Infections is the graph variable. The two row variables are Region and Age. The column variable is Month. The heatmap shows the sum of Infections for each cross section of the row and column variables.
| C1 | C2 | C3 | C4 |
|---|---|---|---|
| Month | Region | Age | Infections |
| July | West | 0-49 | 25 |
| July | South | 0-49 | 906 |
| July | West | 50+ | 282 |
| ... | ... | ... | ... |